Bank of America 2003 Annual Report Download - page 24
Download and view the complete annual report
Please find page 24 of the 2003 Bank of America annual report below. You can navigate through the pages in the report by either clicking on the pages listed below, or by using the keyword search tool below to find specific information within the annual report.-
 1
1 -
2
-
3
-
4
-
5
-
6
-
7
-
8
-
9
-
10
-
11
-
12
-
13
-
 14
14 -
 15
15 -
 16
16 -
 17
17 -
 18
18 -
 19
19 -
 20
20 -
 21
21 -
 22
22 -
 23
23 -
 24
24 -
 25
25 -
 26
26 -
 27
27 -
 28
28 -
 29
29 -
 30
30 -
 31
31 -
 32
32 -
 33
33 -
 34
34 -
35
-
36
-
37
-
38
-
39
-
40
-
41
-
42
-
43
-
44
-
45
-
46
-
47
-
48
-
49
-
50
-
51
-
52
-
53
-
54
-
55
-
56
-
57
-
58
-
59
-
60
-
61
 |
 |

The capital treatment of Trust Securities is currently under review
by the FRB due to the issuing trust companies being deconsolidated
under FIN 46. Depending on the capital treatment resolution, Trust
Securities may no longer qualify for Tier 1 Capital treatment,
but instead would qualify for Tier 2 Capital. On July 2, 2003, the FRB
issued a Supervision and Regulation Letter (the Letter) requiring that
bank holding companies continue to follow the current instructions
for reporting Trust Securities in its regulatory reports. Accordingly, we
will continue to report Trust Securities in Tier 1 Capital until further
notice from the FRB. On September 2, 2003, the FRB and other
regulatory agencies, issued the Interim Final Capital Rule for
Consolidated Asset-backed Commercial Paper Program Assets (the
Interim Rule). The Interim Rule allows companies to exclude from
risk-weighted assets, the newly consolidated assets of asset-backed
commercial paper programs required by FIN 46, when calculating Tier 1
and Total Risk-based Capital ratios through March 31, 2004. As of
December 31, 2003, in accordance with FIN 46, as originally issued,
we consolidated approximately $4.3 billion of assets of multi-seller
asset-backed commercial paper conduits. See Notes 1 and 9 of the
consolidated financial statements for additional information on FIN 46.
Credit Risk Management
Credit risk is the risk of loss arising from a customer or counter-
party’s inability to meet its obligation and exists in our outstanding
loans and leases, trading account assets, derivative assets and
unfunded lending commitments that include loan commitments,
letters of credit and financial guarantees. We define the credit exposure
to a client as the amount representing the maximum loss potential
arising from all these product classifications, except for derivative
positions where we use the current mark-to-market values of the
counterparty component to represent credit exposure without giving
consideration to future mark-to-market changes. Our commercial and
consumer credit extension and review procedures take into account
credit exposures that are both funded and unfunded. For additional
information on derivatives and credit extension commitments, see
Notes 6 and 13 of the consolidated financial statements.
We manage credit risk based on the risk profile of the borrower,
repayment source and the nature of underlying collateral given
current events and conditions. At a macro level, we segregate our
loans in two major groups: commercial and consumer.
Commercial Portfolio Credit Risk Management
Commercial credit risk management begins with an assessment of
the credit risk profile of an individual borrower (or counterparty)
based on an analysis of the borrower’s financial position in conjunc-
tion with current industry, economic and macro geopolitical trends. As
part of the overall credit risk assessment of a borrower, each com-
mercial credit exposure or transaction is assigned a risk rating and is
subject to approval based on defined credit approval standards.
Subsequent to loan origination, risk ratings are adjusted on an ongo-
ing basis, if necessary, to reflect changes in the obligor’s financial
condition, cash flow or ongoing financial viability. We use risk rating
aggregations to measure and evaluate concentrations within portfolios.
Risk ratings are also a factor in determining the level of assigned
economic capital and the allowance for credit losses. In making
decisions regarding credit, we consider risk rating, collateral, country,
industry and single name concentration limits while also balancing
the total client relationship and SVA.
Both our lines of business and Risk Management personnel use
a variety of tools to continuously monitor a borrower/counterparty’s
ability to perform under its obligations. Adjustments in credit exposures
are made as a result of this ongoing analysis and review. Additionally,
we utilize syndication of exposure to other entities, loan sales, credit
derivatives and collateralized loan obligations (CLOs) to manage the
size of the loan portfolio. These activities play an important role in
reducing credit exposures for risk mitigation purposes or where it has
been determined that credit risk concentrations are undesirable.
Banc of America Strategic Solutions, Inc. (SSI) is a majority-
owned consolidated subsidiary of Bank of America, N.A., a wholly-
owned subsidiary of the Corporation, that manages problem asset
resolution and the coordination of exit strategies, if applicable, includ-
ing bulk sales, collateralized debt obligations and other resolutions of
domestic commercial distressed assets. For additional discussion,
see “Problem Loan Management” on page 50.
Consumer Portfolio Credit Risk Management
Credit risk management for consumer credit begins with initial under-
writing and occurs throughout a borrower’s credit cycle. Statistical
techniques are used to establish product pricing, risk appetite, oper-
ating processes and metrics to balance risks and rewards appropri-
ately. Consumer exposure is grouped by product and other attributes
for purposes of evaluating credit risk. Statistical models are built
using detailed behavioral information from external sources such as
credit bureaus as well as internal historical experience. These models
form the foundation of our consumer credit risk management process
and are used in determining approve/decline credit decisions, col-
lections management procedures, portfolio management decisions,
adequacy of the allowance for loan and lease losses, and economic
capital allocation for credit risk.
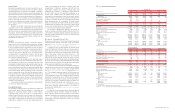
Table 10
Outstanding Loans and Leases
December 31
2003 2002
(Dollars in millions)
Amount Percent Amount Percent
Commercial – domestic
$96,644 26.0% $105,053 30.6%
Commercial – foreign
15,293 4.1 19,912 5.8
Commercial real estate
– domestic
19,043 5.1 19,910 5.8
Commercial real estate
– foreign
324 0.1 295 0.1
Total commercial
131,304 35.3 145,170 42.3
Residential mortgage
140,513 37.8 108,197 31.6
Home equity lines
23,859 6.4 23,236 6.8
Direct/Indirect consumer
33,415 9.0 31,068 9.1
Consumer finance
5,589 1.5 8,384 2.4
Credit card
34,814 9.4 24,729 7.2
Foreign consumer
1,969 0.6 1,971 0.6
Total consumer
240,159 64.7 197,585 57.7
Total(1)
$371,463 100.0% $342,755 100.0%
(1) Includes lease financings of $11,376 and $14,332 at December 31, 2003 and 2002, respectively.
Concentrations of Credit Risk
Portfolio credit risk is evaluated with a goal that concentrations of
credit exposure do not result in undesirable levels of risk. We review
and measure concentrations of credit exposure by industry, product,
geography and customer relationship. Risk due to borrower concentra-
tions is more prevalent in the commercial portfolio. We also review and
measure commercial real estate loans by geographic location and prop-
erty type. Additionally, within our international portfolio, we also evalu-
ate borrowings by region and by country. Tables 11 and 12, Table
X
on
page 63 and Table
XI
on page 64 summarize these concentrations.
From the perspective of portfolio risk management, customer
concentration management is most relevant in Global Corporate and
Inve stme nt Banking. Within Global Corporate and Inve stme nt Banking,
concentrations continue to be addressed through the underwriting
and ongoing monitoring processes, the established strategy of
“originate to distribute” and partly through the purchase of credit pro-
tection through credit derivatives. We utilize various risk mitigation
tools to hedge our economic risk to certain credit counterparties,
including credit default swaps and CLOs in which a layer of loss is
sold to third parties. However, this gives rise to earnings volatility as
a consequence of accounting asymmetry as we mark to market our
credit default swaps through trading account profits and CLOs as
required by SFAS 133, while the loans are recorded at historical cost
less an allowance for credit losses or, if held for sale, the lower of
cost or market.
As previously discussed, the improvement in credit quality con-
tributed to a $731 million, or 61 percent, decrease in provision for
credit losses reported in Global Corporate and Inve stme nt Banking.
However, the credit portfolio hedges lost $330 million in value for
2003 compared to an increase in value of $84 million for 2002 as a
result of narrowing credit spreads due to improved credit quality in
the large corporate sector. At December 31, 2003 and 2002, the
notional amount of these credit derivatives was $14.8 billion and
$16.7 billion, respectively.
During 2003, we entered into several transactions whereby we
purchased credit protection on a portion of our residential mortgage
loan portfolio from unaffiliated parties. These transactions are
designed to aid us as part of our ALM overall risk management strat-
egy. At December 31, 2003, approximately $63.4 billion of residen-
tial mortgage loans were covered by the purchased credit protection.
Our regulatory risk-weighted assets were reduced as a result of this
transaction because we had effectively transferred a degree of credit
risk on these loans to unaffiliated parties. These transactions had
the effect of reducing our risk-weighted assets by $18.6 billion and
resulted in a 26 bp increase in our Tier 1 Risk-based Capital ratio at
December 31, 2003.
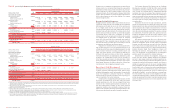
Table 11 shows utilized commercial credit exposure by signi-
ficant industry based on Standard and Poor’s industry classifications
and includes commercial loans and leases, commercial letters of
credit, SBLCs and financial guarantees as well as the mark-to-market
exposure for derivatives. As depicted in the table, we believe that
utilized commercial credit exposure is well-diversified across a range
of industries.
Table 11
Utilized Commercial Credit Exposure by Significant Industry
December 31
(Dollars in millions)
2003 2002
Banks
$25,088 $20,889
Real estate
22,228 22,463
Diversified financials
20,427 21,818
Retailing
15,152 13,560
Education and government
13,919 10,196
Leisure and sports, hotels and restaurants
10,099 10,970
Transportation
9,355 9,941
Food, beverage and tobacco
9,134 9,692
Materials
8,860 11,256
Consumer durables and apparel
8,313 8,078
Capital goods
8,244 9,863
Commercial services and supplies
7,206 7,674
Health care equipment and services
7,064 6,729
Utilities
5,012 8,109
Media
4,701 7,675
Energy
4,348 4,770
Other(1)
33,744 36,285
Total
$212,894 $219,968
(1) At December 31, 2003 and 2002, Other included amounts for Individuals and Trusts of credit
exposure outstanding of $14,307 and $13,481, respectively, representing 6.7 percent and 6.1
percent of total commercial credit exposure, respectively. The remaining balance in Other
included credit exposure to religious and social organizations, insurance, telecommunications
services, technology hardware and equipment, and food and staples retailing.
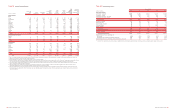
An additional measure of the risk diversification is the distribution of
loans by loan size. Table
IX
on page 63 presents the non-real estate
outstanding commercial loans and leases by significant industry.
Over 99 percent of the non-real estate outstanding commercial loans
and leases were less than $50 million, representing 89 percent of
the total outstanding amount of non-real estate commercial loans
and leases. We believe that the non-real estate commercial loan and
lease portfolio is well-diversified across a range of industries.
Table
X
on page 63 presents outstanding commercial real estate
loans by geographic region and by property type. The amounts pre-
sented in Table
X
do not include outstanding loans and leases that
were made on the general creditworthiness of the borrower, for which
real estate was obtained as security and for which the ultimate repay-
ment of the credit is not dependent on the sale, lease, rental or refi-
nancing of the real estate. Accordingly, the outstandings presented
do not include commercial loans secured by owner-occupied real
estate. Over 99 percent of the commercial real estate loans out-
standing in Table
X
were less than $50 million, representing 96 per-
cent of the total outstanding amount of commercial real estate loans.
We believe the commercial real estate loan portfolio is well-diversi-
fied in terms of both geographic region and property type.
44 BANK OF AMERICA 2003 BANK OF AMERICA 2003 45