Bank of America 2003 Annual Report Download - page 30
Download and view the complete annual report
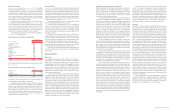
Please find page 30 of the 2003 Bank of America annual report below. You can navigate through the pages in the report by either clicking on the pages listed below, or by using the keyword search tool below to find specific information within the annual report.-
 1
1 -
2
-
3
-
4
-
5
-
6
-
7
-
8
-
9
-
10
-
11
-
12
-
13
-
14
-
15
-
16
-
17
-
18
-
19
-
 20
20 -
 21
21 -
 22
22 -
 23
23 -
 24
24 -
 25
25 -
 26
26 -
 27
27 -
 28
28 -
 29
29 -
 30
30 -
 31
31 -
 32
32 -
 33
33 -
 34
34 -
 35
35 -
 36
36 -
 37
37 -
 38
38 -
 39
39 -
 40
40 -
41
-
42
-
43
-
44
-
45
-
46
-
47
-
48
-
49
-
50
-
51
-
52
-
53
-
54
-
55
-
56
-
57
-
58
-
59
-
60
-
61
 |
 |

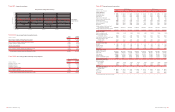
2002 Compared to 2001
The following discussion and analysis provides a comparison of our
results of operations for 2002 and 2001. This discussion should be
read in conjunction with the consolidated financial statements and
related notes on pages 74 through 115. In addition, Tables 1 and 2
contain financial data to supplement this discussion.
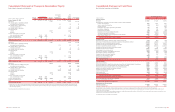
Overview
Net income totaled $9.2 billion, or $5.91 per diluted common share, in
2002 compared to $6.8 billion, or $4.18 per diluted common share, in
2001. The return on average common shareholders’ equity was 19.44
percent in 2002 compared to 13.96 percent in 2001.
Earnings excluding charges related to our strategic decision
to exit certain consumer finance businesses in 2001 were $8.0 bil-
lion, or $4.95 per diluted common share. Excluding these charges,
the return on average common shareholders’ equity was 16.53
percent in 2001. SVA, which excludes exit and restructuring charges,
remained essentially unchanged at $3.1 billion. For additional
information on the use of calculated financial measures and recon-
ciliations to corresponding GAAP measures, see the Supplemental
Financial Data section beginning on page 28.
For the Corporation, an increase in net interest income of $633
million was more than offset by a decline in noninterest income of
$777 million. The impact of higher levels of securities and residen-
tial mortgage loans, higher levels of core deposit funding, the margin
impact of higher trading account assets, consumer loan growth and
the absence of 2001 losses associated with auto lease financing
had a positive effect on net interest income. The securitization of
subprime real estate loans and reduced commercial loan levels
negatively impacted net interest income relative to 2001. The net
interest yield improved seven bps in 2002 from 2001, due to an
increase in consumer loans, higher levels of core deposit funding, the
absence of 2001 losses associated with auto lease financing and
higher levels of securities and residential mortgage loans, offset by
the securitization of subprime real estate loans and higher trading
account assets.
Noninterest income declined as market conditions in 2002
negatively impacted our market-sensitive revenue. This decline was
partially offset by strong performance in consumer-based fee income
and gains recognized in our whole mortgage loan portfolio created by
the interest rate fluctuations that occurred in 2002. Other noninterest
income included gains from whole mortgage loan sales of $500 mil-
lion in 2002 compared to $20 million in 2001. Gains on sales of debt
securities were $630 million, an increase of $155 million from 2001.
The provision for credit losses decreased $590 million, due to
$395 million in 2001 associated with exiting the subprime real
estate lending business. Net charge-offs were down $547 million to
$3.7 billion, or 1.10 percent of average loans and leases, a decrease
of six bps. Decreases in consumer finance and commercial – domes-
tic net charge-offs of $771 million and $478 million, respectively, and
$635 million of charge-offs in 2001 related to exiting the subprime
real estate lending business were partially offset by increases in held
consumer credit card and commercial – foreign net charge-offs of
$422 million and $313 million, respectively.
Nonperforming assets were $5.3 billion, or 1.53 percent of
loans, leases and foreclosed properties at December 31, 2002, a
$354 million increase from December 31, 2001. Nonperforming
assets in the large corporate portfolio within Global Corporate and
Inve stme nt Banking drove the increase, partially offset by credit qual-
ity improvement in the commercial portfolio within Consume r and
Comme rcial Banking.
Noninterest expense declined $2.3 billion as reductions in per-
sonnel expense and professional fees of $147 million and $39 mil-
lion, respectively, were offset by increased data processing and
marketing expenses of $241 million and $71 million, respectively.
Additionally, noninterest expense in 2001 included $1.3 billion of
business exit costs, $662 million in goodwill amortization expense
and $334 million of litigation expenses in fourth quarter 2001.
Excluding these items in 2001, noninterest expense was relatively
unchanged in 2002 compared to the prior year.
Salaries expense declines of $381 million, resulting from a
decrease in incentive compensation, were partially offset by
increased employee benefit costs of $278 million, which largely
resulted from higher healthcare costs and the $69 million impact of
a change in the expected long-term rate of return on plan assets to
8.5 percent for the Bank of America Pension Plan. Incentive com-
pensation, primarily in Global Co rporate and Inve stme nt Banking,
declined $258 million, consistent with reductions in market-sensitive
revenues. In the fourth quarter of 2002, we also recorded a $128 mil-
lion severance charge related to outsourcing and strategic alliances.
Reduced consulting and other professional fees reflected the
increased use of in-house personnel for consulting and productivity-
related activities. Data processing expense increases reflected $45
million in costs associated with terminated contracts on discontinued
software licenses in the third quarter of 2002, as well as higher vol-
umes of online bill pay activity, check imaging and higher item pro-
cessing and check clearing expenses. Marketing expense increased in
2002 as we expanded our advertising campaign. Advertising efforts
primarily focused on card, mortgage, online banking and bill pay.
Income tax expense in 2002 was $3.7 billion resulting in an effec-
tive tax rate of 28.8 percent. During 2002, we reached a settlement
with the IRS generally covering tax years ranging from 1984 to 1999
but including returns as far back as 1971. As a result of this settle-
ment, we recorded a $488 million reduction in income tax expense.
Business Segment Operations
Consume r and Comme rcial Banking
Total revenue increased $2.0 billion, or nine percent, in 2002 com-
pared to 2001. An increase in average loans and leases, deposit
growth and the results of our ALM process contributed to the $1.3
billion, or ten percent, increase in net interest income. These
increases were offset by the compression of deposit interest mar-
gins. Increases in mortgage banking income of 27 percent, service
charges of eight percent and card income of eight percent drove the
$638 million, or eight percent, increase in noninterest income. These
increases were offset by a decrease in trading account profits. Net
income rose $1.2 billion, or 22 percent, due to the increases in net
interest income and noninterest income discussed above, offset by
an increase in the provision for credit losses. Higher provision in the
credit card loan portfolio, offset by a decline in provision within
Comme rcial Banking resulted in a $226 million, or 14 percent,
increase in the provision for credit losses.
Asse t Manage me nt
Total revenue declined $120 million, or five percent, in 2002. Net inter-
est income declined $12 million, or two percent, due to the impact of
declines in loan balances and loan yields. Noninterest income
decreased $108 million, or six percent. This decline was due to a
decrease in investment and brokerage services activities, which
reflected the current market environment. Declines in personal asset
management fees and brokerage income more than offset an increase
in mutual fund fees. Provision expense increased $195 million, driven
by the charge-off of one large credit in the Private Bank. The elimination
of goodwill amortization of $51 million and lower revenue-related incen-
tive compensation of $44 million were the drivers of the $67 million,
or four percent, decrease in noninterest expense. These decreases
were partially offset by increased expenses related to the growth of the
segment’s distribution capabilities. Net income decreased $144 mil-
lion, or 28 percent. Assets under management remained relatively flat
in 2002 compared to 2001, as the decline in equity funds due to the
weakened economic environment was offset by an increase in money
market and other short-term fixed income funds.
Global Corporate and Inve stme nt Banking
Total revenue in Global Corporate and Inve stme nt Banking declined
$818 million, or nine percent, in 2002 driven by a decline in trading-
related revenue. Net interest income increased by $192 million, or
four percent, as a result of higher net interest income from trading-
related activities and the results of our ALM process offset by lower
commercial loan levels. Noninterest income declined $1.0 billion, or
21 percent, resulting from declines in trading account profits and
investment banking income, offset by increases in investment and
brokerage services, and service charges. In 2002, net income
decreased $282 million, or 15 percent as improvements in noninter-
est expense and credit-related costs were offset by a decline in rev-
enue. Noninterest expense decreased by $399 million, or seven
percent, driven by lower market-based compensation and the elimi-
nation of goodwill amortization. Provision expense declined $84 mil-
lion in 2002 to $1.2 billion due to lower loan levels and higher than
normal recoveries.
Equity Inve stme nts
In 2002, both revenue and net income substantially decreased due
to higher Principal Inve sting impairment charges. Principal Inve sting
recorded cash gains of $432 million, offset by impairment charges of
$708 million and fair value adjustment losses of $10 million.
Noninterest income primarily consists of equity investment gains
(losses). Weakness in equity markets in 2002 and a $140 million
gain in the strategic investments portfolio in the first quarter of 2001
related to the sale of an interest in the Star Systems ATM network
were the primary drivers for the decline in equity investment gains.
56 BANK OF AMERICA 2003 BANK OF AMERICA 2003 57