Bank of America 2003 Annual Report Download - page 28
Download and view the complete annual report
Please find page 28 of the 2003 Bank of America annual report below. You can navigate through the pages in the report by either clicking on the pages listed below, or by using the keyword search tool below to find specific information within the annual report.-
 1
1 -
2
-
3
-
4
-
5
-
6
-
7
-
8
-
9
-
10
-
11
-
12
-
13
-
14
-
15
-
16
-
17
-
 18
18 -
 19
19 -
 20
20 -
 21
21 -
 22
22 -
 23
23 -
 24
24 -
 25
25 -
 26
26 -
 27
27 -
 28
28 -
 29
29 -
 30
30 -
 31
31 -
 32
32 -
 33
33 -
 34
34 -
 35
35 -
 36
36 -
 37
37 -
 38
38 -
39
-
40
-
41
-
42
-
43
-
44
-
45
-
46
-
47
-
48
-
49
-
50
-
51
-
52
-
53
-
54
-
55
-
56
-
57
-
58
-
59
-
60
-
61
 |
 |

To e valuate risk in our trading activities, we focus on the actual and
potential volatility of individual positions as well as portfolios. At a
portfolio and corporate level, we use Value-at-Risk (VAR) modeling
and stress testing. VAR is a key statistic used to measure and man-
age market risk. Trader limits and VAR are used to manage day-to-day
risks and are subject to testing where we compare expected per-
formance to actual performance. This testing provides us a view of
our models’ predictive accuracy. All limit excesses are communicated
to senior management for review.
A VAR model estimates a range of hypothetical scenarios within
which the next day’s profit or loss is expected. These estimates are
impacted by the nature of the positions in the portfolio and the cor-
relation within the portfolio. Within any VAR model, there are signifi-
cant and numerous assumptions that will differ from company to
company. Our VAR model assumes a 99 percent confidence level.
During the fourth quarter of 2002, we completed an enhancement of
our methodology used in the VAR risk aggregation calculation. This
approach utilizes historical market conditions over the last three
years to derive estimates of trading risk and provides the ability to
aggregate trading risk across different businesses. Historically, we
used a mathematical method to allocate risk across different trading
businesses that did not assume the benefit of diversification across
markets. This change resulted in a lower VAR calculation starting in
the fourth quarter 2002.
The reduction in average VAR for 2003 was primarily due to the
2002 methodology enhancements and the $5 million decline in real
estate/mortgages, partially offset by increases in equities of $11
million. The increase in equities was mainly due to the increased eco-
nomic risk from customer-facilitated business that was held in inven-
tory throughout the first three quarters of 2003 and sold during the
fourth quarter 2003. The large increase in the interest rate and total
trading portfolio high VAR was due to activities on one day during the
period. The next highest VAR for interest rates and total trading port-
folio was $47.4 million and $61.2 million, respectively, during 2003.
Stress Te sting
Because the very nature of a VAR model suggests results can exceed
our estimates, we “stress test” our portfolio. Stress testing esti-
mates the value change in our trading portfolio due to abnormal mar-
ket movements. Various stress scenarios are run regularly against
the trading portfolio to verify that, even under extreme market moves,
we will preserve our capital; to determine the effects of significant
historical events; and to determine the effects of specific, extreme
hypothetical, but plausible events. The results of the stress scenar-
ios are calculated daily and reported to senior management as part
of the regular reporting process. The results of certain specific,
extreme hypothetical scenarios are presented to ALCO.
In addition, each business has established risk concentration
limits with the goal of ensuring the amount of risk taken within each
business is consistent with the risk appetite for that business. Each
business is independently monitored to assure adherence to
approved risk measures, limits and controls. The primary risk mitiga-
tion tool involves monitoring exposures relative to concentration, bal-
ance sheet, notional and derivative limits.
Interest Rate Risk Management
Interest rate risk represents the most significant market risk expo-
sure to our nontrading financial instruments. Our overall goal is to
manage interest rate sensitivity so that movements in interest rates
do not adversely affect net interest income. Interest rate risk is
measured as the potential volatility to our net interest income caused
by changes in market interest rates. Client facing activities, primarily
lending and deposit-taking, create interest rate sensitive positions on
our balance sheet. Interest rate risk from these activities as well as
the impact of ever-changing market conditions, is mitigated using the
ALM process.
Sensitivity simulations are used to estimate the impact on net
interest income of numerous interest rate scenarios, balance sheet
trends and strategies. These simulations estimate levels of short-term
Statistically this means that losses will exceed VAR, on average, one
out of 100 trading days, or two to three times a year. Actual losses
exceeded VAR twice in 2003, did not exceed VAR in 2002 and
exceeded VAR once in 2001.
There are numerous assumptions and estimates associated
with modeling, and actual results could differ. In addition to reviewing
our underlying model assumptions with senior management, we mit-
igate the uncertainties related to these assumptions and estimates
through close monitoring and by updating the assumptions and esti-
mates on an ongoing basis. If the results of our analysis indicate
higher than expected levels of risk, proactive measures are taken to
adjust risk levels.
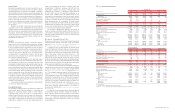
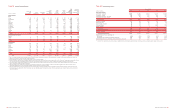
Table 18 presents average, high and low daily VAR for both 2003
and 2002.
financial instruments, securities, loans, deposits, borrowings and
derivative instruments. In addition, these simulations incorporate
assumptions about balance sheet dynamics such as loan and deposit
growth and pricing, changes in funding mix, and asset and liability
repricing and maturity characteristics. In addition to net interest
income sensitivity simulations, market value sensitivity measures are
also utilized.
The Balance Sheet Management group maintains a net interest
income forecast utilizing different rate scenarios, including a most
likely scenario, which is designed around an economic forecast that
is meant to estimate our expectation of the most likely path of rates
for the upcoming horizon. The Balance Sheet Management group con-
stantly updates the net interest income forecast for changing
assumptions and differing outlooks based on economic trends and
market conditions.
The Balance Sheet Management group reviews the impact on
net interest income of parallel and nonparallel shifts in the yield
curve over different horizons. The overall interest rate risk position
and strategies are reviewed on an ongoing basis with ALCO. At
December 31, 2003, we were positioned to benefit from rising long-
term interest rates, with short-term interest rates being stable.
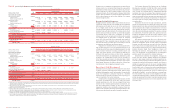
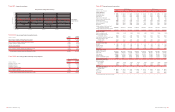
Table 19 provides our estimated net interest income at risk over
the subsequent year from December 31, 2003 and 2002, resulting
from a 100 bp gradual (over 12 months) increase or decrease in inter-
est rates from the forward curve calculated as of December 31, 2003
and 2002, respectively. Beginning in the third quarter 2003, these
shocks were applied to the forward interest rate curve implied by the
financial markets. Previously, these shocks were applied to current
interest rates held stable. This change more closely aligns these risk
measures with management’s view of this risk. The prior period has
been restated to conform to the current methodology.
Table 19
Estimated Net Interest Income at Risk
-100 bp +100 bp
December 31, 2003
1.2% (1.1)%
December 31, 2002
0.5% 1.4%
As part of the ALM process, we use securities, residential mortgages,
and interest rate and foreign exchange derivatives in managing interest
rate sensitivity.
Se curitie s
The securities portfolio is integral to our ALM process. The decision
to purchase or sell securities is based upon the current assessment
of economic and financial conditions, including the interest rate envi-
ronment, liquidity and regulatory requirements, and the relative mix of
cash and derivative positions. In 2003 and 2002, we purchased
securities of $195.9 billion and $146.0 billion, respectively, sold
$171.5 billion and $137.1 billion, respectively and received pay-
downs of $27.2 billion and $25.0 billion, respectively. Not included in
the purchases above were $65.2 billion of forward purchase con-
tracts of both mortgage-backed securities and mortgage loans at
December 31, 2003 settling from January 2004 to February 2004
with an average yield of 5.79 percent, and $3.5 billion of forward pur-
chase contracts of both mortgage-backed securities and mortgage
loans at December 31, 2002 settling in January 2003 with an aver-
age yield of 5.91 percent. These forward purchase contracts,
included in Table 20, were accounted for as derivatives and their net-
of-tax unrealized gains and losses were included in accumulated
other comprehensive income (OCI). The pre-tax unrealized gain on
these forward purchase contracts at December 31, 2003 and 2002
was $1.9 billion and $58 million, respectively. There were also $8.0
billion of forward sale contracts of mortgage-backed securities at
December 31, 2003 settling in February 2004 with an average yield
of 6.14 percent, and $19.7 billion of forward sale contracts of mort-
gage-backed securities at December 31, 2002 settling in January and
February 2003 with an average yield of 6.05 percent. These forward
sale contracts, included in Table 20, were accounted for as deriva-
tives and their net-of-tax unrealized gains and losses were included
in accumulated OCI. The pre-tax unrealized gain on these forward
sale contracts at December 31, 2003 was $22 million compared to
a pre-tax unrealized loss of $189 million at December 31, 2002.
During the year, we continuously monitored the interest rate risk posi-
tion of the portfolio and repositioned the securities portfolio in order
to mitigate risk and to take advantage of interest rate fluctuations.
Through sales in the securities portfolio, we realized $941 million
and $630 million in gains on sales of debt securities during 2003
and 2002, respectively.
Re side ntial Mortgage Portfolio
We repositioned the ALM mortgage loan portfolio to mitigate prepay-
ment risk resulting from the unusually low rate environment. The res-
idential mortgages, a component of our ALM strategy, grew primarily
through whole loan purchase activity. In 2003 and 2002, we pur-
chased $92.8 billion and $55.0 billion, respectively, of residential
mortgages in the wholesale market for our ALM portfolio and interest
rate risk management. Not included in the purchases above were
$4.6 billion of forward purchase commitments of mortgage loans at
December 31, 2003 settling in January 2004. These commitments,
included in Table 20, were accounted for as derivatives at December
31, 2003 under the provisions of SFAS No. 149 “Amendment of
Statement 133 on Derivative Instruments and Hedging Activities”
(SFAS 149) and their net-of-tax unrealized gains and losses were
included in accumulated OCI. The pre-tax unrealized gain on these
forward purchase commitments at December 31, 2003 was $10 mil-
lion. During 2003 and 2002, we sold $27.5 billion and $22.7 billion,
respectively, of whole mortgage loans and recognized $772 million
and $500 million, respectively, in gains on the sales included in other
noninterest income. Additionally, during the same periods we
received paydowns of $62.8 billion and $36.9 billion, respectively.
Inte re st Rate and Fore ign Exchange De rivative Contracts
Interest rate and foreign exchange derivative contracts are utilized in our
ALM process and serve as an efficient, low-cost tool to mitigate our risk.
We use derivatives to hedge or offset the changes in cash flows or mar-
ket values of our balance sheet. See Note 6 of the consolidated finan-
cial statements for additional information on our hedging activities.
Our interest rate contracts are generally nonleveraged generic
interest rate and basis swaps, options, futures and forwards. In addi-
tion, we use foreign currency contracts to mitigate the foreign
exchange risk associated with foreign-denominated assets and liabil-
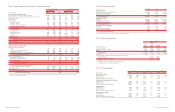
ities, as well as our equity investments in foreign subsidiaries. Table
20 reflects the notional amounts, fair value, weighted average receive
fixed and pay fixed rates, expected maturity and estimated duration
of our ALM derivatives at December 31, 2003 and 2002.
52 BANK OF AMERICA 2003 BANK OF AMERICA 2003 53
Table 18
Trading Activities Market Risk
2003 2002
Average High Low Average High Low
(Dollars in millions) VAR VAR(1) VAR(1) VAR VAR(1) VAR(1)
Foreign exchange
$4.1 $7.8 $ 2.1 $3.2 $ 7.1 $ 0.5
Interest rate
27.0 65.2 15.1 28.8 40.3 17.3
Credit(2)
20.7 32.6 14.9 14.8 21.6 6.5
Real estate/mortgage(3)
14.1 41.4 3.6 19.2 61.6 2.5
Equities
19.9 53.8 6.6 8.8 18.2 4.3
Commodities
8.7 19.3 4.1 9.2 15.4 3.4
Portfolio diversification
(60.9) – – (43.9) – –
Total trading portfolio
$33.6 $91.0 $11.2 $40.1 $69.8 $19.2
(1) The high and low for the total portfolio may not equal the sum of the individual components as the highs or lows of the individual portfolios may have occurred on different trading days.
(2) Credit includes credit fixed income and credit default swaps used for credit risk management.
(3) Real estate/mortgage, which is included in the fixed income category in Table 3 includes capital market real estate and mortgage banking certificates.