Bank of America 2003 Annual Report Download - page 29
Download and view the complete annual report
Please find page 29 of the 2003 Bank of America annual report below. You can navigate through the pages in the report by either clicking on the pages listed below, or by using the keyword search tool below to find specific information within the annual report.-
 1
1 -
2
-
3
-
4
-
5
-
6
-
7
-
8
-
9
-
10
-
11
-
12
-
13
-
14
-
15
-
16
-
17
-
18
-
 19
19 -
 20
20 -
 21
21 -
 22
22 -
 23
23 -
 24
24 -
 25
25 -
 26
26 -
 27
27 -
 28
28 -
 29
29 -
 30
30 -
 31
31 -
 32
32 -
 33
33 -
 34
34 -
 35
35 -
 36
36 -
 37
37 -
 38
38 -
 39
39 -
40
-
41
-
42
-
43
-
44
-
45
-
46
-
47
-
48
-
49
-
50
-
51
-
52
-
53
-
54
-
55
-
56
-
57
-
58
-
59
-
60
-
61
 |
 |

54 BANK OF AMERICA 2003 BANK OF AMERICA 2003 55
Consistent with our strategy of managing interest rate sensitivity, the
notional amount of our net received fixed interest rate swap position
decreased $33.6 billion to $21.2 billion at December 31, 2003 com-
pared to December 31, 2002 to mitigate changes in value of other
financial instruments. The net option position increased $36.6 billion
to $85.0 billion at December 31, 2003 compared to December 31,
2002 to offset interest rate risk in other portfolios. This increase
occurred throughout 2003.
Mortgage Banking Risk Management
Mortgage production activities create unique interest rate and pre-
payment risk. Interest rate risk occurs between the loan commitment
date (pipeline) and the date the loan is sold to the secondary mar-
ket. To mitigate interest rate risk, we enter into various financial
instruments including interest rate swaps, forward delivery contracts,
Eurodollar futures and option contracts. The notional amount of such
contracts was $13.1 billion at December 31, 2003 with associated
net unrealized losses of $42 million. At December 31, 2002, the
notional amount of such contracts was $25.3 billion with associated
net unrealized losses of $224 million. Of these net unrealized
losses, $27 million and $140 million, respectively, were recorded in
accumulated OCI. These unrealized losses at December 31, 2003
and 2002 were offset by economic gains in the warehouse that will
be recognized upon delivery to the secondary market.
Prepayment risk represents the loss in value associated with a
high rate loan paying off in a low rate environment and the loss of
servicing value when loans prepay. We mitigate prepayment risk using
various financial instruments including purchased options and
swaps. The notional amounts of such contracts at December 31,
2003 and 2002 were $64.2 billion and $53.1 billion, respectively.
The related unrealized loss was $328 million at December 31, 2003
compared to an unrealized gain of $955 million at December 31,
2002. These amounts are included in the Derivatives table in Note 6
of the consolidated financial statements. See Note 1 of the consoli-
dated financial statements for additional discussion of these finan-
cial instruments in the mortgage banking assets section.
Operational Risk Management
Operational risk is the potential for loss resulting from events involv-
ing people, processes, technology, external events, execution, legal,
compliance and regulatory matters, and reputation. Successful oper-
ational risk management is particularly important to a diversified
financial services company like ours because of the very nature, vol-
ume and complexity of our various businesses.
In keeping with our management governance structure, the lines
of business are responsible for all the risks within the business
including operational risks. Such risks are managed through corpo-
rate-wide or line of business specific policies and procedures, con-
trols and monitoring tools. Examples of these include personnel
management practices, data reconciliation processes, fraud man-
agement units, transaction processing monitoring and analysis, busi-
ness recovery planning, and new product introduction processes.
The Corporate Operational Risk Executive and the Compliance
Risk Executive, reporting to the Chief Risk Officer, provide oversight
to facilitate the consistency of effective policies, “best industry prac-
tices”, controls and monitoring tools for managing and assessing
operational risks across the company. These executives also work
with the business segment executives and their risk counterparts to
implement appropriate policies, processes and assessments at the
line of business level. Compliance and operational risk awareness is
also driven across the company through training and strategic com-
munication efforts.
Operational risks fall into two major classifications, business
specific and corporate-wide risks affecting all business lines. At the
business segment level, there are Business Segment Risk Executives
that are responsible for oversight of all operational risks in the busi-
ness segments they support. In their management of these specific
risks, they utilize corporate-wide operational risk policies, processes
and assessments. For business specific risks, operational and com-
pliance risk management work with the business segments to drive
consistency in policies, processes, assessments and use of “best
industry practices.”
With respect to corporate-wide risks, such as information secu-
rity, business recovery, legal and compliance, operational and com-
pliance risk management assess the risks, develop a consolidated
corporate view and communicate that view to the line of business
level. To help assess and manage corporate-wide risks, we also uti-
lize specialized support groups, such as Legal, Information Security,
Business Recovery, Supply Chain Management, Finance, and
Technology and Operations. These groups assist the lines of busi-
ness in the development and implementation of risk management
practices specific to the needs of the individual businesses.
Operational and compliance risk management, working in con-
junction with senior business segment executives, have developed
key tools to help manage, monitor and summarize operational risk.
One such tool the businesses and executive management utilize is a
corporate-wide quarterly self-assessment process, which helps to
identify and evaluate the status of risk issues, including mitigation
plans, if appropriate. The goal of this process, which originates at the
line of business level, is to continuously assess changing market and
business conditions. The self-assessment process also assists in
identifying emerging operational risk issues and determining how
they should be managed – at the line of business or corporate level.
The risks identified in this process are also integrated into our quar-
terly financial forecasting process. In addition to the self-assessment
process, key operational risk indicators have been developed and are
used to help identify trends and issues on both a corporate and a line
of business level.
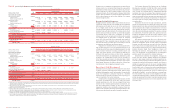
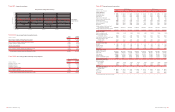
Table 20
Asset and Liability Management Interest Rate and Foreign Exchange Contracts
December 31, 2003
Average
(Dollars in millions, average
Fair Expected Maturity Estimated
estimated duration in years)
Value Total 2004 2005 2006 2007 2008 Thereafter Duration
Open interest rate contracts
Total receive fixed swaps(1)
$(1,204) 5.45
Notional amount
$156,772 $ – $ 4,580 $ 4,363 $36,348 $36,199 $75,282
Weighted average receive rate
3.78% –% 3.61% 5.22% 3.18% 3.00% 4.38%
Total pay fixed swaps(1)
(2,103) 5.41
Notional amount
$135,578 $ 81 $ 3,688 $ 14,581 $39,254 $13,650 $64,324
Weighted average pay rate
4.01% 6.04% 2.13% 2.93% 3.34% 3.78% 4.82%
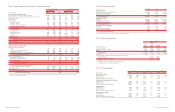
Basis swaps
38
Notional amount
$16,356 $ 9,000 $ 500 $ 4,400 $ 45 $ 590 $ 1,821
Total swaps
(3,269)
Option products(2)
1,582
Net notional amount(3)
$84,965 $ 1,267 $50,000 $ 3,000 $ – $30,000 $ 698
Futures and forward rate contracts(4)
1,908
Net notional amount(3)
$106,156 $86,156 $20,000 $ – $ – $ – $ –
Total open interest rate contracts
221
Closed interest rate contracts(5,6)
839
Net interest rate contract position
1,060
Open foreign exchange contracts
1,129
Notional amount
$7,364 $ 100 $ 488 $ 468 $ (379) $ 1,560 $ 5,127
Total ALM contracts
$2,189
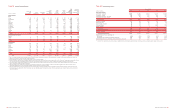
December 31, 2002
Average
(Dollars in millions, average
Fair Expected Maturity Estimated
estimated duration in years)
Value Total 2003 2004 2005 2006 2007 Thereafter Duration
Open interest rate contracts
Total receive fixed swaps(1)
$4,449 4.89
Notional amount
$116,520 $ 3,132 $ 3,157 $ 5,719 $14,078 $16,213 $74,221
Weighted average receive rate
4.29% 1.76% 3.17% 4.66% 4.50% 3.90% 4.46%
Total pay fixed swaps(1)
(1,825) 4.07
Notional amount
$61,680 $10,083 $ 5,694 $ 7,993 $15,068 $ 6,735 $16,107
Weighted average pay rate
3.60% 1.64% 2.46% 3.90% 3.17% 3.62% 5.48%
Basis swaps
(3)
Notional amount
$15,700 $ – $ 9,000 $ 500 $ 4,400 $ – $ 1,800
Total swaps
2,621
Option products(2)
650
Net notional amount(3)
$48,374 $ 1,000 $ 6,767 $40,000 $ – $ – $ 607
Futures and forward rate contracts(4)
(88)
Net notional amount(3)
$8,850 $(6,150) $15,000
Total open interest rate contracts
3,183
Closed interest rate contracts(5,6)
955
Net interest rate contract position
4,138
Open foreign exchange contracts
313
Notional amount
$4,672 $ 78 $ 648 $ 102 $ 1,581 $ 96 $ 2,167
Total ALM contracts
$4,451
(1) At December 31, 2003, $14.2 billion of the receive fixed swap notional and $114.5 billion of the pay fixed swap notional represented forward starting swaps that will not be effective until their respective
contractual start dates. At December 31, 2002, $39.0 billion of the receive fixed swap notional and $22.4 billion of the pay fixed swap notional represented forward starting swaps that will not be effective
until their respective contractual start dates.
(2) Option products include caps, floors and exchange-traded options on index futures contracts. These strategies may include option collars or spread strategies, which involve the buying and selling
of options on the same underlying security or interest rate index.
(3) Reflects the net of long and short positions.
(4) Futures and forward rate contracts include Eurodollar futures, U.S. Treasury futures and forward purchase and sale contracts. Included are $69.8 billion of forward purchase contracts and
$8.0 billion of forward sale contracts of mortgage-backed securities and mortgage loans, at December 31, 2003, as discussed on page 53. At December 31, 2002 the forward purchase and sale
contracts of mortgage-backed securities and mortgage loans amounted to $3.5 billion and $19.7 billion, respectively.
(5) Represents the unamortized net realized deferred gains associated with closed contracts. As a result, no notional amount is reflected for expected maturity.
(6) The $839 million and $955 million deferred gains on closed interest rate contracts primarily consisted of gains on closed ALM swaps. Of these unamortized net realized deferred gains, $238 million
gain was included in accumulated OCI and $601 million gain was included as a basis adjustment of long-term debt at December 31, 2003. As of December 31, 2002, $234 million was included in
accumulated OCI and the remainder was a basis adjustment of long-term debt.