Bank of America 2003 Annual Report Download - page 54
Download and view the complete annual report
Please find page 54 of the 2003 Bank of America annual report below. You can navigate through the pages in the report by either clicking on the pages listed below, or by using the keyword search tool below to find specific information within the annual report.-
 1
1 -
2
-
3
-
4
-
5
-
6
-
7
-
8
-
9
-
10
-
11
-
12
-
13
-
14
-
15
-
16
-
17
-
18
-
19
-
20
-
21
-
22
-
23
-
24
-
25
-
26
-
27
-
28
-
29
-
30
-
31
-
32
-
33
-
34
-
35
-
36
-
37
-
38
-
39
-
40
-
41
-
42
-
43
-
 44
44 -
 45
45 -
 46
46 -
 47
47 -
 48
48 -
 49
49 -
 50
50 -
 51
51 -
 52
52 -
 53
53 -
 54
54 -
 55
55 -
 56
56 -
 57
57 -
 58
58 -
 59
59 -
 60
60 -
 61
61
 |
 |

104 BANK OF AMERICA 2003
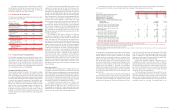
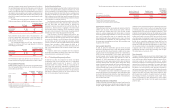
For 2003, 2002 and 2001, net periodic postretirement benefit cost
included the following components:
(Dollars in millions)
2003 2002 2001
Components of net
periodic postretirement
benefit cost (income)
Service cost
$9 $11 $11
Interest cost
68 67 65
Expected return on plan assets
(15) (17) (21)
Amortization of transition obligation
32 32 32
Amortization of prior service cost
464
Recognized net actuarial loss
89 40 20
Net periodic postretirement
benefit cost
$187 $139 $111
Weighted average assumptions
used to determine net cost
for years ended December 31
Discount rate
6.75% 7.25% 7.25%
Expected return on plan assets
8.50 8.50 10.00
Net periodic postretirement health and life expense was determined
using the “projected unit credit” actuarial method. Gains and losses
for all benefits except postretirement health care are recognized in
accordance with the standard amortization provisions of the applica-
ble accounting standards. For the Postretirement Health Care Plans,
50 percent of the unrecognized gain or loss at the beginning of the
fiscal year (or at subsequent remeasurement) is recognized on a level
basis during the year.
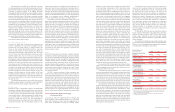
Assumed health care cost trend rates affect the postretirement
benefit obligation and benefit cost reported for the Postretirement
Health Care Plans. The assumed health care cost trend rates used
to measure the expected cost of benefits covered by the
Postretirement Health Care Plans was 10 percent for 2004, reducing
in steps to 5 percent in 2007 and later years. A one-percentage-point
increase in assumed health care cost trend rates would have
increased the service and interest costs and the benefit obligation by
$4 million and $52 million, respectively, in 2003, $5 million and $61
million, respectively, in 2002, and $6 million and $52 million, respec-
tively, in 2001. A one-percentage-point decrease in assumed health
care cost trend rates would have lowered the service and interest
costs and the benefit obligation by $3 million and $48 million,
respectively, in 2003, $4 million and $52 million, respectively, in
2002 and $4 million and $45 million, respectively, in 2001.
Plan Assets
The Pension Plan has been established as a retirement vehicle for
participants and a trust has been established to secure benefits
promised under the Pension Plan. The Corporation’s policy is to
invest the trust assets in a prudent manner for the exclusive purpose
of providing benefits to participants and defraying reasonable
expenses of administration. The Corporation’s investment strategy is
designed to provide a total return that, over the long-term, increases
the ratio of assets to liabilities. The strategy attempts to maximize
the investment return on assets at a level of risk deemed appropri-
ate by the Corporation while complying with ERISA and any subse-
quent applicable regulations and laws. The investment strategy
utilizes asset allocation as a principal determinant for establishing
the risk/reward profile of the assets. Asset allocation ranges are
established, periodically reviewed, and adjusted as funding levels and
liability characteristics change. Active and passive investment man-
agers are employed to help enhance the risk/return profile of the
assets. An additional aspect of the investment strategy used to min-
imize risk (part of the asset allocation plan) includes matching the
equity exposure of participant-selected earnings measures. For
example, the common stock of the Corporation invested in the trust
is maintained as an offset to the exposure related to participants
who selected to receive an earnings measure based on the return
performance of common stock of the Corporation.
The Expected Return on Asset Assumption (EROA assumption)
was developed through analysis of historical market returns, historical
asset class volatility and correlations, current market conditions, antic-
ipated future asset allocations, the fund’s past experience, and expec-
tations on potential future market returns. The EROA assumption
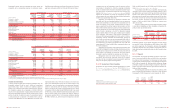
BANK OF AMERICA 2003 105
return on plan assets will be 8.50 percent for 2004. The expected return on plan assets is calculated using the calculated market-related value
for the Pension Plan and the fair value for the Postretirement Health and Life Plans. The asset valuation method for the Pension Plan recog-
nizes 60 percent of the market gains or losses in the first year, with the remaining 40 percent spread equally over the next four years.
Qualified Nonqualified Postretirement
Pension Plan(1) Pension Plans(1) Health and Life Plans(1)
(Dollars in millions)
2003 2002 2003 2002 2003 2002
Change in fair value of plan assets
(Primarily listed stocks, fixed income and real estate)
Fair value, January 1
$7,518 $8,264 $– $– $181 $194
Actual return on plan assets
1,671 (722) ––25 (13)
Company contributions(2)
400 700 47 39 13 84
Plan participant contributions
––––62 49
Benefits paid
(614) (724) (47) (39) (125) (133)
Fair value, December 31
$8,975 $7,518 $– $– $156 $181
Change in projected benefit obligation
Projected benefit obligation, January 1
$7,627 $7,606 $652 $529 $1,058 $944
Service cost
187 199 25 27 911
Interest cost
514 540 45 44 68 67
Plan participant contributions
––––62 49
Plan amendments
–6–(4) (36) 8
Actuarial loss
714 –37 108 91 112
Effect of curtailments
–––(15) ––
Effect of special termination benefits
–––2––
Benefits paid
(614) (724) (47) (39) (125) (133)
Projected benefit obligation, December 31
$8,428 $7,627 $712 $652 $1,127 $1,058
Funded status, December 31
Accumulated benefit obligation (ABO)
$8,028 $7,264 $628 $573 n/a n/a
Overfunded (unfunded) status of ABO
947 254 (628) (573) n/a n/a
Provision for future salaries
400 363 84 79 n/a n/a
Projected benefit obligation (PBO)
8,428 7,627 712 652 1,127 1,058
Overfunded (unfunded) status of PBO
$547 $(109) $(712) $(652) $(971) $(877)
Unrecognized net actuarial loss
2,153 2,422 195 168 139 147
Unrecognized transition obligation
–––1291 323
Unrecognized prior service cost
364 419 18 21 646
Prepaid (accrued) benefit cost
$3,064 $2,732 $(499) $(462) $(535) $(361)
Weighted average assumptions, December 31
Discount rate
6.25% 6.75% 6.25% 6.75% 6.25% 6.75%
Expected return on plan assets
8.50 8.50 8.50 n/a 8.50 8.50
Rate of compensation increase
4.00 4.00 4.00 4.00 n/a n/a
n/a = not applicable
(1) The measurement date for the Qualified Pension Plan, Nonqualified Pension Plans and Postretirement Health and Life Plans was December 31 of each year reported.
(2) The Corporation’s best estimate of its contributions to be made to the Qualified Pension Plan, Nonqualified Pension Plans and Postretirement Health and Life Plans in 2004 is $0, $64 and $23, respectively.
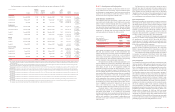
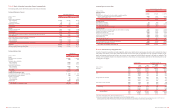
Amounts recognized in the consolidated financial statements at December 31, 2003 and 2002 are as follows:
Qualified Nonqualified Postretirement
Pension Plan Pension Plans Health and Life Plans
(Dollars in millions)
2003 2002 2003 2002 2003 2002
Prepaid benefit cost
$3,064 $2,732 $– $– $– $–
Accrued benefit cost
––(499) (462) (535) (361)
Additional minimum liability
––(129) (111) ––
Intangible asset
––18 22 ––
Accumulated other comprehensive income
––111 89 ––
Net amount recognized at end of year
$3,064 $2,732 $(499) $(462) $(535) $(361)
Net periodic pension benefit cost for 2003, 2002 and 2001 included the following components:
Qualified Pension Plan Nonqualified Pension Plans
(Dollars in millions) 2003 2002 2001 2003 2002 2001
Components of net periodic pension benefit cost (income)
Service cost
$187 $199 $ 202 $25 $27
$22
Interest cost
514 540 560 45 44
40
Expected return on plan assets
(735) (746) (876) ––
–
Amortization of transition asset
––(2) ––
–
Amortization of prior service cost
55 55 54 310
11
Recognized net actuarial loss
47 –– 11 11
7
Recognized loss due to settlements and curtailments
––– –26
6
Net periodic pension benefit cost (income)
$68 $48$(62) $84 $118
$86
Weighted average assumptions used to
determine net cost for years ended December 31
Discount rate
6.75% 7.25% 7.25% 6.75% 7.25%
7.25%
Expected return on plan assets
8.50 8.50 10.00 n/a n/a n/a
Rate of compensation increase
4.00 4.00 4.00 4.00 4.00
4.00
n/a = not applicable