Bank of America 2003 Annual Report Download - page 35
Download and view the complete annual report
Please find page 35 of the 2003 Bank of America annual report below. You can navigate through the pages in the report by either clicking on the pages listed below, or by using the keyword search tool below to find specific information within the annual report.-
 1
1 -
2
-
3
-
4
-
5
-
6
-
7
-
8
-
9
-
10
-
11
-
12
-
13
-
14
-
15
-
16
-
17
-
18
-
19
-
20
-
21
-
22
-
23
-
24
-
 25
25 -
 26
26 -
 27
27 -
 28
28 -
 29
29 -
 30
30 -
 31
31 -
 32
32 -
 33
33 -
 34
34 -
 35
35 -
 36
36 -
 37
37 -
 38
38 -
 39
39 -
 40
40 -
 41
41 -
 42
42 -
 43
43 -
 44
44 -
 45
45 -
46
-
47
-
48
-
49
-
50
-
51
-
52
-
53
-
54
-
55
-
56
-
57
-
58
-
59
-
60
-
61
 |
 |

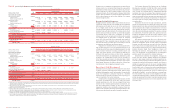
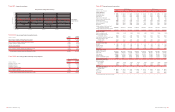
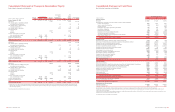
Table XIII
Allowance for Credit Losses
(Dollars in millions)
2003 2002 2001 2000 1999
Allowance for loan and lease losses, January 1 $ 6,358 $6,278 $ 6,365 $ 6,314 $ 6,557
Loans and leases charged off
Commercial – domestic
(989) (1,793) (2,120) (1,412) (820)
Commercial – foreign
(408) (566) (249) (117) (161)
Commercial real estate – domestic
(46) (45) (46) (31) (19)
Commercial real estate – foreign
–––(1) (1)
Total commercial
(1,443) (2,404) (2,415) (1,561) (1,001)
Residential mortgage
(64) (56) (39) (36) (35)
Home equity lines
(38) (40) (32) (29) (24)
Direct/Indirect consumer
(322) (355) (389) (395) (434)
Consumer finance(1)
(280) (333) (1,137) (512) (445)
Credit card
(1,657) (1,210) (753) (392) (571)
Other consumer domestic
(57) (57) (73) (66) (52)
Foreign consumer
(6) (5) (6) (4) (20)
Total consumer
(2,424) (2,056) (2,429) (1,434) (1,581)
Total loans and leases charged off
(3,867) (4,460) (4,844) (2,995) (2,582)
Recoveries of loans and leases previously charged off
Commercial – domestic
232 322 171 125 109
Commercial – foreign
102 45 41 31 17
Commercial real estate – domestic
5871825
Commercial real estate – foreign
–––3–
Total commercial
339 375 219 177 151
Residential mortgage
24 14 13 9 7
Home equity lines
26 14 13 9 12
Direct/Indirect consumer
141 145 139 149 150
Consumer finance
68 78 111 178 170
Credit card
143 116 815476
Other consumer domestic
19 21 23 18 13
Foreign consumer
1–113
Total consumer
422 388 381 418 431
Total recoveries of loans and leases previously charged off
761 763 600 595 582
Net charge-offs
(3,106) (3,697) (4,244) (2,400) (2,000)
Provision for loan and lease losses(2)
2,916 3,801 4,163 2,576 1,871
Other, net
(5) (24) (6) (125) (114)
Allowance for loan and lease losses, December 31
$6,163 $6,358 $ 6,278 $ 6,365 $ 6,314
Reserve for unfunded lending commitments, January 1
$493 $597 $473 $514 $ 565
Provision for unfunded lending commitments
(77) (104) 124 (41) (51)
Reserve for unfunded lending commitments, December 31
$416 $493 $597 $473 $ 514
Total
$6,579 $6,851 $ 6,875 $ 6,838 $ 6,828
Loans and leases outstanding at December 31
$371,463 $342,755 $ 329,153 $ 392,193 $ 370,662
Allowance for loan and lease losses as a percentage of loans
and leases outstanding at December 31
1.66% 1.85% 1.91% 1.62% 1.70%
Average loans and leases outstanding during the year
$356,148 $336,819 $ 365,447 $ 392,622 $ 362,783
Net charge-offs as a percentage of average outstanding loans
and leases during the year
0.87% 1.10% 1.16% 0.61% 0.55%
Allowance for loan and lease losses as a percentage of nonperforming
loans at December 31
215 126 139 122 208
Ratio of allowance for loan and lease losses at December 31 to
net charge-offs
1.98 1.72 1.48 2.65 3.16
(1) Includes $635 related to the exit of the subprime real estate lending business in 2001.
(2) Includes $395 related to the exit of the subprime real estate lending business in 2001.
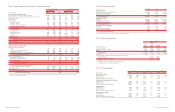
Table XIV
Allocation of the Allowance for Credit Losses by Product Type
December 31
2003 2002 2001 2000 1999
(Dollars in millions)
Amount Percent Amount Percent Amount Percent Amount Percent Amount Percent
Allowance for loan and lease losses
Commercial – domestic
$1,420 21.6% $2,231 32.5% $ 1,901 27.7% $1,926 28.2% $1,818 26.6%
Commercial – foreign
619 9.4 855 12.5 730 10.6 778 11.4 901 13.2
Commercial real estate – domestic
404 6.2 430 6.3 897 13.0 973 14.2 916 13.4
Commercial real estate – foreign
90.1 90.1 8 0.1 7 0.1 11 0.2
Total commercial
2,452 37.3 3,525 51.4 3,536 51.4 3,684 53.9 3,646 53.4
Residential mortgage
149 2.3 108 1.6 145 2.1 151 2.2 160 2.3
Home equity lines
61 0.9 49 0.7 83 1.2 77 1.1 60 0.9
Direct/Indirect consumer
340 5.2 361 5.3 367 5.3 320 4.7 355 5.2
Consumer finance
376 5.7 323 4.7 433 6.3 722 10.6 712 10.4
Credit card
1,602 24.3 1,031 15.1 821 12.0 549 8.0 348 5.1
Foreign consumer
80.1 90.1 10 0.1 11 0.2 11 0.2
Total consumer
2,536 38.5 1,881 27.5 1,859 27.0 1,830 26.8 1,646 24.1
General
1,175 17.9 952 13.9 883 12.9 851 12.4 1,022 15.0
Allowance for loan and lease losses
$6,163 93.7% $6,358 92.8% $ 6,278 91.3% $6,365 93.1% $6,314 92.5%
Reserve for unfunded lending commitments
Commercial – domestic
$80 1.2% $160 2.3% $ 73 1.1% $ 67 1.0% $ 57 0.8%
Commercial – foreign
60 0.9 32 0.5 36 0.5 18 0.3 29 0.4
Commercial real estate
50.1 90.1 27 0.4 16 0.2 11 0.2
Total commercial
145 2.2 201 2.9 136 2.0 101 1.5 97 1.4
General
271 4.1 292 4.3 461 6.7 372 5.4 417 6.1
Reserve for unfunded lending
commitments
$416 6.3% $493 7.2% $ 597 8.7% $ 473 6.9% $ 514 7.5%
Total
$6,579 100.0% $6,851 100.0% $ 6,875 100.0% $6,838 100.0% $6,828 100.0%
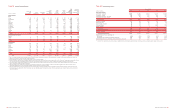
Table XV
Cross-border Exposure Exceeding One Percent of Total Assets(1,2)
Cross- Exposure
Public Private border as a Percentage
(Dollars in millions)
December 31 Sector Banks Sector Exposure of Total Assets
United Kingdom
2003 $ 143 $3,426 $6,552 $10,121 1.37%
2002 167 2,492 6,758 9,417 1.42
2001 139 2,807 8,889 11,835 1.90
Germany
2003 $ 441 $3,436 $2,978 $ 6,855 0.93%
2002 334 2,898 2,534 5,766 0.87
2001 2,118 2,571 2,251 6,940 1.12
(1) Exposure includes cross-border claims by the Corporation’s foreign offices as follows: loans, accrued interest receivable, acceptances, time deposits placed, trading account assets, securities, derivative
assets, other interest-earning investments and other monetary assets. Amounts also include unused commitments, SBLCs, commercial letters of credit and formal guarantees.
(2) Sector definitions are based on the FFIEC instructions for preparing the Country Exposure Report.
66 BANK OF AMERICA 2003 BANK OF AMERICA 2003 67