Bank of America 2003 Annual Report Download - page 39
Download and view the complete annual report
Please find page 39 of the 2003 Bank of America annual report below. You can navigate through the pages in the report by either clicking on the pages listed below, or by using the keyword search tool below to find specific information within the annual report.-
 1
1 -
2
-
3
-
4
-
5
-
6
-
7
-
8
-
9
-
10
-
11
-
12
-
13
-
14
-
15
-
16
-
17
-
18
-
19
-
20
-
21
-
22
-
23
-
24
-
25
-
26
-
27
-
28
-
 29
29 -
 30
30 -
 31
31 -
 32
32 -
 33
33 -
 34
34 -
 35
35 -
 36
36 -
 37
37 -
 38
38 -
 39
39 -
 40
40 -
 41
41 -
 42
42 -
 43
43 -
 44
44 -
 45
45 -
 46
46 -
 47
47 -
 48
48 -
 49
49 -
50
-
51
-
52
-
53
-
54
-
55
-
56
-
57
-
58
-
59
-
60
-
61
 |
 |

74 BANK OF AMERICA 2003 BANK OF AMERICA 2003 75
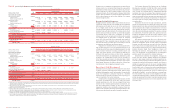
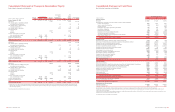
Consolidated Statement of Income
Bank of America Corporation and Subsidiaries
Year Ended December 31
(Dollars in millions, except per share information)
2003 2002 2001
Interest income
Interest and fees on loans and leases
$21,668 $22,030 $27,279
Interest on debt securities
3,160 4,035 3,706
Federal funds sold and securities purchased under agreements to resell
1,373 870 1,414
Trading account assets
3,935 3,811 3,623
Other interest income
1,507 1,415 2,271
Total interest income
31,643 32,161 38,293
Interest expense
Deposits
4,908 5,434 8,886
Short-term borrowings
1,951 2,089 4,167
Trading account liabilities
1,286 1,260 1,155
Long-term debt
2,034 2,455 3,795
Total interest expense
10,179 11,238 18,003
Net interest income
21,464 20,923 20,290
Noninterest income
Consumer service charges
3,230 2,986 2,865
Corporate service charges
2,388 2,290 2,078
Total service charges
5,618 5,276 4,943
Consumer investment and brokerage services
1,559 1,544 1,546
Corporate investment and brokerage services
792 693 566
Total investment and brokerage services
2,351 2,237 2,112
Mortgage banking income
1,922 761 597
Investment banking income
1,736 1,545 1,579
Equity investment gains (losses)
215 (280) 291
Card income
3,052 2,620 2,422
Trading account profits
409 778 1,842
Other income(1)
1,119 634 562
Total noninterest income
16,422 13,571 14,348
Total revenue
37,886 34,494 34,638
Provision for credit losses
2,839 3,697 4,287
Gains on sales of debt securities
941 630 475
Noninterest expense
Personnel
10,446 9,682 9,829
Occupancy
2,006 1,780 1,774
Equipment
1,052 1,124 1,115
Marketing
985 753 682
Professional fees
844 525 564
Amortization of intangibles
217 218 878
Data processing
1,104 1,017 776
Telecommunications
571 481 484
Other general operating
2,902 2,856 3,302
Business exit costs
––1,305
Total noninterest expense
20,127 18,436 20,709
Income before income taxes
15,861 12,991 10,117
Income tax expense
5,051 3,742 3,325
Net income
$10,810 $9,249 $ 6,792
Net income available to common shareholders
$10,806 $9,244 $
6,787
Per common share information
Earnings
$7.27 $6.08 $ 4.26
Diluted earnings
$7.13 $5.91 $ 4.18
Dividends paid
$2.88 $2.44 $ 2.28
Average common shares issued and outstanding (in thousands)
1,486,703 1,520,042 1,594,957
Average diluted common shares issued and outstanding (in thousands)
1,515,178 1,565,467 1,625,654
(1) Other income includes whole mortgage loan sale gains totaling $772, $500 and $27 for the years ended December 31, 2003, 2002 and 2001, respectively.
See accompanying notes to consolidated financial statements.
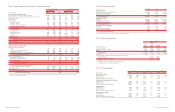
Consolidated Balance Sheet
Bank of America Corporation and Subsidiaries
December 31
(Dollars in millions)
2003 2002
Assets
Cash and cash equivalents
$27,084 $24,973
Time deposits placed and other short-term investments
8,051 6,813
Federal funds sold and securities purchased under agreements to resell (includes $76,446
and $44,779 pledged as collateral)
76,492 44,878
Trading account assets (includes $18,722 and $35,515 pledged as collateral)
68,547 63,996
Derivative assets
36,507 34,310
Debt securities:
Available-for-sale (includes $20,858 and $32,919 pledged as collateral)
67,993 68,122
Held-to-maturity, at cost (market value – $254 and $1,001)
247 1,026
Total debt securities
68,240 69,148
Loans and leases
371,463 342,755
Allowance for loan and lease losses
(6,163) (6,358)
Loans and leases, net of allowance
365,300 336,397
Premises and equipment, net
6,036 6,717
Mortgage banking assets
2,762 2,110
Goodwill
11,455 11,389
Core deposit intangibles and other intangibles
908 1,095
Other assets
65,063 59,125
Total assets
$736,445 $660,951
Liabilities
Deposits in domestic offices:
Noninterest-bearing
$118,495 $122,686
Interest-bearing
262,032 232,320
Deposits in foreign offices:
Noninterest-bearing
3,035 1,673
Interest-bearing
30,551 29,779
Total deposits
414,113 386,458
Federal funds purchased and securities sold under agreements to repurchase
78,046 65,079
Trading account liabilities
26,844 25,574
Derivative liabilities
24,526 23,566
Commercial paper and other short-term borrowings
42,478 25,234
Accrued expenses and other liabilities
27,115 17,545
Long-term debt
75,343 61,145
Trust preferred securities
– 6,031
Total liabilities
688,465 610,632
Commitments and contingencies (Note 13)
Shareholders’ equity
Preferred stock, $0.01 par value; authorized – 100,000,000 shares; issued and outstanding –
1,269,600 and 1,356,749 shares
54 58
Common stock, $0.01 par value; authorized – 5,000,000,000 shares; issued and outstanding –
1,441,143,786 and 1,500,691,103 shares
14 496
Retained earnings
50,213 48,517
Accumulated other comprehensive income (loss)
(2,148) 1,232
Other (153)
16
Total shareholders’ equity
47,980 50,319
Total liabilities and shareholders’ equity
$736,445 $660,951
See accompanying notes to consolidated financial statements.