Bank of America 2003 Annual Report Download - page 57
Download and view the complete annual report
Please find page 57 of the 2003 Bank of America annual report below. You can navigate through the pages in the report by either clicking on the pages listed below, or by using the keyword search tool below to find specific information within the annual report.-
 1
1 -
2
-
3
-
4
-
5
-
6
-
7
-
8
-
9
-
10
-
11
-
12
-
13
-
14
-
15
-
16
-
17
-
18
-
19
-
20
-
21
-
22
-
23
-
24
-
25
-
26
-
27
-
28
-
29
-
30
-
31
-
32
-
33
-
34
-
35
-
36
-
37
-
38
-
39
-
40
-
41
-
42
-
43
-
44
-
45
-
46
-
 47
47 -
 48
48 -
 49
49 -
 50
50 -
 51
51 -
 52
52 -
 53
53 -
 54
54 -
 55
55 -
 56
56 -
 57
57 -
 58
58 -
 59
59 -
 60
60 -
 61
61
 |
 |

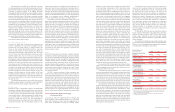
During 2002, the Corporation reached a tax settlement agreement
with the Internal Revenue Service (IRS). This agreement resolved
issues for numerous tax returns of the Corporation and various pred-
ecessor companies and finalized all federal income tax liabilities
through 1999. As a result of the settlement, reductions in income tax
expense of $84 million in 2003 and $488 million in 2002 were
recorded resulting from refunds received and reductions in previously
accrued taxes.
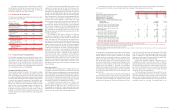
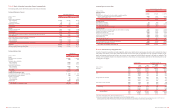
Significant components of the Corporation’s deferred tax liabili-
ties and assets at December 31, 2003 and 2002 were as follows:
December 31
(Dollars in millions)
2003 2002
Deferred tax liabilities
Equipment lease financing
$5,321 $5,767
Intangibles
955 535
Investments
905 700
State taxes
281 310
Depreciation
246 229
Employee retirement benefits
191 250
Deferred gains and losses
189 149
Securities valuation
–350
Available-for-sale debt securities
–266
Other
560 511
Gross deferred tax liabilities
8,648 9,067
Deferred tax assets
Allowance for credit losses
2,421 2,661
Securities valuation
1,876 –
Accrued expenses
421 412
Employee benefits
174 77
Net operating loss carryforwards
129 315
Loan fees and expenses
85 99
Available-for-sale debt securities
46 –
Other
280 212
Gross deferred tax assets
5,432 3,776
Valuation allowance
(120) (114)
Gross deferred tax assets,
net of valuation allowance
5,312 3,662
Net deferred tax liabilities
$3,336 $5,405
The valuation allowance included in the Corporation’s deferred tax
assets at December 31, 2003 and 2002 represented net operating
loss carryforwards for which it is more likely than not that realization
will not occur and expire in 2004 to 2009. The net change in the val-
uation allowance for deferred tax assets resulted from net operating
losses being generated by foreign subsidiaries in 2003 where real-
ization is not expected to occur.
At December 31, 2003 and 2002, federal income taxes had not
been provided on $871 million and $770 million, respectively, of
undistributed earnings of foreign subsidiaries, earned prior to 1987
and after 1997, that have been reinvested for an indefinite period of
time. If the earnings were distributed, an additional $185 million and
$171 million of tax expense, net of credits for foreign taxes paid on
such earnings and for the related foreign withholding taxes, would
result in 2003 and 2002, respectively.
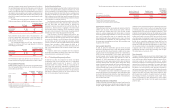
Note 19 Fair Value of Financial Instruments
SFAS No. 107, “Disclosures About Fair Value of Financial
Instruments” (SFAS 107), requires the disclosure of the estimated
fair value of financial instruments. The fair value of a financial instru-
ment is the amount at which the instrument could be exchanged in a
current transaction between willing parties, other than in a forced or
liquidation sale. Quoted market prices, if available, are utilized as
estimates of the fair values of financial instruments. Since no quoted
market prices exist for certain of the Corporation’s financial instru-
ments, the fair values of such instruments have been derived based
on management’s assumptions, the estimated amount and timing of
future cash flows and estimated discount rates. The estimation meth-
ods for individual classifications of financial instruments are
described more fully below. Different assumptions could significantly
affect these estimates. Accordingly, the net realizable values could
be materially different from the estimates presented below. In addi-
tion, the estimates are only indicative of the value of individual finan-
cial instruments and should not be considered an indication of the
fair value of the combined Corporation.
The provisions of SFAS 107 do not require the disclosure of the
fair value of lease financing arrangements and nonfinancial instru-
ments, including intangible assets such as goodwill, franchise, and
credit card and trust relationships.
Short-Term Financial Instruments
The carrying value of short-term financial instruments, including cash
and cash equivalents, time deposits placed, federal funds sold and
purchased, resale and repurchase agreements, commercial paper
and other short-term investments and borrowings, approximates the
fair value of these instruments. These financial instruments generally
expose the Corporation to limited credit risk and have no stated
maturities or have short-term maturities and carry interest rates that
approximate market.
Financial Instruments Traded in the Secondary Market
Held-to-maturity debt securities, available-for-sale debt and mar-
ketable equity securities, trading account instruments and long-term
debt traded actively in the secondary market have been valued using
quoted market prices. The fair values of securities and trading
account instruments are reported in Notes 4 and 5 of the consoli-
dated financial statements.
Derivative Financial Instruments
All derivatives are recognized on the balance sheet at fair value, tak-
ing into consideration the effects of legally enforceable master net-
ting agreements that allow the Corporation to settle positive and
negative positions with the same counterparty on a net basis. For
exchange-traded contracts, fair value is based on quoted market
prices. For non-exchange-traded contracts, fair value is based on
dealer quotes, pricing models or quoted prices for instruments with
similar characteristics. The fair value of the Corporation’s derivative
assets and liabilities is presented in Note 6 of the consolidated finan-
cial statements.
Loans
Fair values were estimated for groups of similar loans based upon
type of loan and maturity. The fair value of loans was determined by
discounting estimated cash flows using interest rates approximating
the Corporation’s current origination rates for similar loans and
adjusted to reflect the inherent credit risk. Where quoted market
prices were available, primarily for certain residential mortgage loans
and commercial loans, such market prices were utilized as estimates
for fair values.
Substantially all of the foreign loans reprice within relatively
short timeframes. Accordingly, for foreign loans, the net carrying val-
ues were assumed to approximate their fair values.
Mortgage Banking Assets
The Certificates are carried at estimated fair value based on an
option-adjusted spread model that requires several key components
including, but not limited to, proprietary prepayment models and term
structure modeling via Monte Carlo simulation.
Deposits
The fair value for deposits with stated maturities was calculated by
discounting contractual cash flows using current market rates for
instruments with similar maturities. The carrying value of foreign time
deposits approximates fair value. For deposits with no stated matu-
rities, the carrying amount was considered to approximate fair value
and does not take into account the significant value of the cost
advantage and stability of the Corporation’s long-term relationships
with depositors.
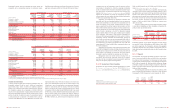
The book and fair values of certain financial instruments at
December 31, 2003 and 2002 were as follows:
December 31
2003 2002
Book Fair Book Fair
(Dollars in millions)
Value Value Value Value
Financial assets
Loans
$353,924 $357,770 $322,065 $330,306
Financial liabilities
Deposits
414,113 414,379 386,458 387,166
Long-term debt(1)
75,343 79,442 61,145 64,935
Trust preferred securities(1)
––6,031 6,263
(1) Long-term debt includes long-term debt related to Trust Securities in 2003.
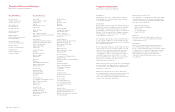
Note 20 Business Segment Information
The Corporation reports the results of its operations through four
business segments: Consume r and Comme rcial Banking, Asse t
Manage me nt, Global Corporate and Inve stme nt Banking and Equity
Inve stme nts. Certain operating segments have been aggregated into
a single business segment.
Consume r and Comme rcial Banking provides a diversified range
of products and services to individuals and small businesses through
multiple delivery channels. The segment also includes commercial
lending and treasury management services primarily to middle mar-
ket companies with annual revenue between $10 million and $500
million. Asse t Manage me nt offers investment, fiduciary and compre-
hensive banking and credit expertise; asset management services to
institutional clients, high-net-worth individuals and retail customers;
and investment, securities and financial planning services to affluent
and high-net-worth individuals. Glo bal Co rporate and Inve stme nt
Banking provides capital raising solutions, advisory services, deriva-
tives capabilities, equity and debt sales and trading for our corporate,
commercial and institutional clients as well as traditional bank
deposit and loan products, cash management and payment services
to large corporations and institutional clients. Equity Inve stme nts
includes Principal Inve sting,which is comprised of a diversified port-
folio of investments in privately-held and publicly-traded companies at
all stages, from start-up to buyout.
Corporate Othe r consists primarily of certain amounts associ-
ated with the ALM process and certain consumer finance and com-
mercial lending businesses that are being liquidated. Beginning in
the first quarter of 2003, net interest income from certain results
associated with the ALM process was allocated directly to the busi-
ness units. Prior periods have been restated to reflect this change in
methodology. In addition, compensation expense related to stock-
based employee compensation plans is included in Corporate Othe r.
Total revenue includes net interest income on a fully taxable-
equivalent basis and noninterest income. The net interest income of
the business segments includes the results of a funds transfer pric-
ing process that matches assets and liabilities with similar interest
rate sensitivity and maturity characteristics. Net interest income also
reflects an allocation of net interest income generated by assets and
liabilities used in the Corporation’s ALM process.
Segments are allocated provision for credit losses based on
charge-offs and changes in their profile balances and credit risk port-
folio. This adjustment was based on an estimate of the related seg-
ment’s contribution to the improvement in credit quality experienced
by the Corporation.
Certain expenses not directly attributable to a specific business
segment are allocated to the segments based on pre-determined
means. The most significant of these expenses include data pro-
cessing and item processing costs. Data processing costs are allo-
cated to the segments based on equipment usage. Additionally, item
processing costs are allocated to the segments based on the volume
of items processed for each segment.
110 BANK OF AMERICA 2003 BANK OF AMERICA 2003 111