Bank of America 2003 Annual Report Download - page 59
Download and view the complete annual report
Please find page 59 of the 2003 Bank of America annual report below. You can navigate through the pages in the report by either clicking on the pages listed below, or by using the keyword search tool below to find specific information within the annual report.-
 1
1 -
2
-
3
-
4
-
5
-
6
-
7
-
8
-
9
-
10
-
11
-
12
-
13
-
14
-
15
-
16
-
17
-
18
-
19
-
20
-
21
-
22
-
23
-
24
-
25
-
26
-
27
-
28
-
29
-
30
-
31
-
32
-
33
-
34
-
35
-
36
-
37
-
38
-
39
-
40
-
41
-
42
-
43
-
44
-
45
-
46
-
47
-
48
-
 49
49 -
 50
50 -
 51
51 -
 52
52 -
 53
53 -
 54
54 -
 55
55 -
 56
56 -
 57
57 -
 58
58 -
 59
59 -
 60
60 -
 61
61
 |
 |

114 BANK OF AMERICA 2003 BANK OF AMERICA 2003 115
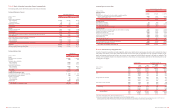
Condensed Statement of Cash Flows
Year Ended December 31
(Dollars in millions)
2003 2002 2001
Operating activities
Net income
$10,810 $9,249 $ 6,792
Reconciliation of net income to net cash provided by operating activities:
Equity in undistributed earnings (losses) of subsidiaries
(2,187) 1,867 (2,504)
Other operating activities, net
115 (2,537) 1,768
Net cash provided by operating activities
8,738 8,579 6,056
Investing activities
Net purchases of securities
(59) (428) (24)
Net payments to subsidiaries
(1,160) (2,025) (3,330)
Other investing activities, net
(1,597) (158) –
Net cash used in investing activities
(2,816) (2,611) (3,354)
Financing activities
Net increase (decrease) in commercial paper and other short-term borrowings
2,482 (7,505) (5,154)
Proceeds from issuance of long-term debt
14,713 8,753 10,762
Retirement of long-term debt
(5,928) (1,464) (6,106)
Proceeds from issuance of common stock
4,207 2,632 1,121
Common stock repurchased
(9,799) (7,466) (4,716)
Cash dividends paid
(4,281) (3,709) (3,632)
Other financing activities, net
276 (338) 763
Net cash used in financing activities
1,670 (9,097) (6,962)
Net increase (decrease) in cash held at bank subsidiaries
7,592 (3,129) (4,260)
Cash held at bank subsidiaries at January 1
12,844 15,973 20,233
Cash held at bank subsidiaries at December 31
$20,436 $12,844 $15,973
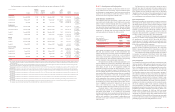
Note 22 Performance by Geographic Area
Since the Corporation’s operations are highly integrated, certain asset, liability, income and expense amounts must be allocated to arrive at
total assets, total revenue, income (loss) before income taxes and net income (loss) by geographic area. The Corporation identifies its geo-
graphic performance based upon the business unit structure used to manage the capital or expense deployed in the region as applicable. This
requires certain judgments related to the allocation of revenue so that revenue can be appropriately matched with the related expense or cap-
ital deployed in the region.
At December 31 Year Ended December 31
Income (Loss) Net
Total Total Before Income
(Dollars in millions) Year Assets(1) Revenue(2) Income Taxes (Loss)
Domestic(3)
2003 $ 680,843 $ 36,267 $ 15,703 $ 10,676
2002 610,731 32,645 13,268 9,374
2001 570,029 32,301 9,572 6,404
Asia
2003 22,468 467 125 101
2002 18,654 720 293 205
2001 17,382 892 383 259
Europe, Middle East and Africa
2003 30,107 1,037 187 131
2002 27,304 989 (159) (76)
2001 28,172 1,211 395 269
Latin America and the Caribbean
2003 3,027 115 (154) (98)
2002 4,262 140 (411) (254)
2001 6,778 234 (233) (140)
Total Foreign
2003 55,602 1,619 158 134
2002 50,220 1,849 (277) (125)
2001 52,332 2,337 545 388
Total Consolidated
2003 $ 736,445 $ 37,886 $ 15,861 $ 10,810
2002 660,951 34,494 12,991 9,249
2001 622,361 34,638 10,117 6,792
(1) Total assets includes long-lived assets, which are primarily located in the U.S.
(2) There were no material intercompany revenues between geographic regions for any of the periods presented.
(3) Includes the Corporation’s Canadian operations, which had total assets of $2,799, $2,666 and $2,849 at December 31, 2003, 2002 and 2001, respectively; total revenues of $96, $96 and $121;
income before income taxes of $60, $111 and $4; and net income of $12, $83 and $0.3 for the years ended December 31, 2003, 2002 and 2001, respectively.
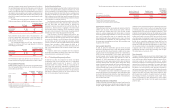
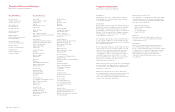
Note 21 Bank of America Corporation (Parent Company Only)
The following tables present the Parent Company Only financial information:
Condensed Statement of Income
Year Ended December 31
(Dollars in millions)
2003 2002 2001
Income
Dividends from subsidiaries:
Bank subsidiaries
$8,950 $11,100 $5,000
Other subsidiaries
34 10 32
Interest from subsidiaries
610 775 1,746
Other income
2,140 1,138 1,772
Total income
11,734 13,023 8,550
Expense
Interest on borrowed funds
1,391 1,700 2,564
Noninterest expense
2,181 1,361 2,083
Total expense
3,572 3,061 4,647
Income before income tax benefit and equity in undistributed earnings of subsidiaries
8,162 9,962 3,903
Income tax benefit
461 1,154 385
Income before equity in undistributed earnings of subsidiaries
8,623 11,116 4,288
Equity in undistributed earnings of subsidiaries:
Bank subsidiaries
2,093 (1,607) 2,653
Other subsidiaries
94 (260) (149)
Total equity in undistributed earnings (losses) of subsidiaries
2,187 (1,867) 2,504
Net income
$10,810 $9,249 $6,792
Net income available to common shareholders
$10,806 $9,244 $6,787
Condensed Balance Sheet
December 31
(Dollars in millions)
2003 2002
Assets
Cash held at bank subsidiaries
$20,436 $12,844
Securities
1,441 989
Receivables from subsidiaries:
Bank subsidiaries
10,042 7,802
Other subsidiaries
15,103 16,682
Investments in subsidiaries:
Bank subsidiaries
59,085 58,662
Other subsidiaries
818 654
Other assets
13,459 8,420
Total assets
$120,384 $106,053
Liabilities and shareholders’ equity
Commercial paper and other short-term borrowings
$3,333 $453
Accrued expenses and other liabilities
7,469 3,094
Payables to subsidiaries:
Bank subsidiaries
173 193
Other subsidiaries
29 5,479
Long-term debt
61,400 46,515
Shareholders’ equity
47,980 50,319
Total liabilities and shareholders’ equity
$120,384 $106,053