Bank of America 2003 Annual Report Download - page 31
Download and view the complete annual report
Please find page 31 of the 2003 Bank of America annual report below. You can navigate through the pages in the report by either clicking on the pages listed below, or by using the keyword search tool below to find specific information within the annual report.-
 1
1 -
2
-
3
-
4
-
5
-
6
-
7
-
8
-
9
-
10
-
11
-
12
-
13
-
14
-
15
-
16
-
17
-
18
-
19
-
20
-
 21
21 -
 22
22 -
 23
23 -
 24
24 -
 25
25 -
 26
26 -
 27
27 -
 28
28 -
 29
29 -
 30
30 -
 31
31 -
 32
32 -
 33
33 -
 34
34 -
 35
35 -
 36
36 -
 37
37 -
 38
38 -
 39
39 -
 40
40 -
 41
41 -
42
-
43
-
44
-
45
-
46
-
47
-
48
-
49
-
50
-
51
-
52
-
53
-
54
-
55
-
56
-
57
-
58
-
59
-
60
-
61
 |
 |

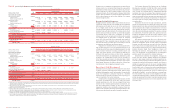
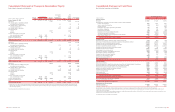
58 BANK OF AMERICA 2003 BANK OF AMERICA 2003 59
Statistical Financial Information
Bank of America Corporation and Subsidiaries
Table I
Average Balances and Interest Rates – Fully Taxable-equivalent Basis
2003 2002 2001
Interest Interest Interest
Average Income/ Yield/ Average Income/ Yield/ Average Income/ Yield/
(Dollars in millions) Balance Expense Rate Balance Expense Rate Balance Expense Rate
Earning assets
Time deposits placed and other short-term investments
$9,056 $ 172 1.90% $10,038 $ 243 2.42% $ 6,723 $ 318 4.73%
Federal funds sold and securities purchased under agreements to resell
78,857 1,373 1.74 45,640 870 1.91 35,202 1,414 4.02
Trading account assets
97,222 3,993 4.11 79,562 3,860 4.85 66,418 3,653 5.50
Debt securities
72,267 3,223 4.46 75,298 4,100 5.44 60,372 3,761 6.23
Loans and leases(1):
Commercial – domestic
99,000 6,971 7.04 109,724 7,370 6.72 133,569 9,879 7.40
Commercial – foreign
17,489 613 3.50 21,287 824 3.87 26,492 1,567 5.90
Commercial real estate – domestic
19,740 850 4.31 21,161 1,043 4.93 24,607 1,700 6.91
Commercial real estate – foreign
302 12 3.99 408 17 4.23 348 20 6.08
Total commercial
136,531 8,446 6.19 152,580 9,254 6.06 185,016 13,166 7.12
Residential mortgage
127,059 6,872 5.41 97,204 6,423 6.61 81,472 5,920 7.27
Home equity lines
22,890 1,040 4.55 22,807 1,213 5.32 22,013 1,625 7.38
Direct/Indirect consumer
32,593 1,964 6.03 30,264 2,145 7.09 30,374 2,466 8.12
Consumer finance
6,888 520 7.54 10,533 856 8.12 27,709 2,242 8.09
Credit card
28,210 2,886 10.23 21,410 2,195 10.25 16,641 1,879 11.29
Foreign consumer
1,977 68 3.43 2,021 74 3.68 2,222 127 5.80
Total consumer
219,617 13,350 6.08 184,239 12,906 7.01 180,431 14,259 7.90
Total loans and leases
356,148 21,796 6.12 336,819 22,160 6.58 365,447 27,425 7.50
Other earning assets
43,953 1,729 3.94 26,164 1,517 5.80 26,154 2,065 7.90
Total earning assets(2)
657,503 32,286 4.91 573,521 32,750 5.71 560,316 38,636 6.90
Cash and cash equivalents
22,637 21,166 22,542
Other assets, less allowance for loan and lease losses
83,992 68,256 67,225
Total assets
$764,132 $662,943 $650,083
Interest-bearing liabilities
Domestic interest-bearing deposits:
Savings
$24,538 $ 108 0.44% $21,691 $ 138 0.64% $ 20,208 $ 213 1.05%
NOW and money market deposit accounts
148,896 1,236 0.83 131,841 1,369 1.04 114,657 2,498 2.18
Consumer CDs and IRAs
70,246 2,784 3.96 67,695 2,968 4.39 74,458 3,853 5.17
Negotiable CDs, public funds and other time deposits
7,627 130 1.70 4,237 128 3.03 5,848 290 4.96
Total domestic interest-bearing deposits
251,307 4,258 1.69 225,464 4,603 2.04 215,171 6,854 3.19
Foreign interest-bearing deposits(3):
Banks located in foreign countries
13,959 403 2.89 15,464 442 2.86 23,397 1,053 4.49
Governments and official institutions
2,218 31 1.40 2,316 43 1.86 3,615 152 4.21
Time, savings and other
19,027 216 1.14 18,769 346 1.84 22,940 827 3.62
Total foreign interest-bearing deposits
35,204 650 1.85 36,549 831 2.27 49,952 2,032 4.07
Total interest-bearing deposits
286,511 4,908 1.71 262,013 5,434 2.07 265,123 8,886 3.35
Federal funds purchased, securities sold under agreements
to repurchase and other short-term borrowings
147,580 1,951 1.32 104,153 2,089 2.01 92,476 4,167 4.51
Trading account liabilities
37,176 1,286 3.46 31,600 1,261 3.99 29,995 1,155 3.85
Long-term debt(4)
68,432 2,034 2.97 66,045 2,455 3.72 69,622 3,795 5.45
Total interest-bearing liabilities(2)
539,699 10,179 1.89 463,811 11,239 2.42 457,216 18,003 3.94
Noninterest-bearing sources:
Noninterest-bearing deposits
119,722 109,466 97,529
Other liabilities
55,507 42,053 46,660
Shareholders’ equity
49,204 47,613 48,678
Total liabilities and shareholders’ equity
$764,132 $662,943 $650,083
Net interest spread
3.02 3.29 2.96
Impact of noninterest-bearing sources
0.34 0.46 0.72
Net interest income/yield on earning assets
$22,107 3.36% $21,511 3.75% $20,633 3.68%
(1) Nonperforming loans are included in the respective average loan balances. Income on such nonperforming loans is recognized on a cash basis.
(2) Interest income includes the impact of interest rate risk management contracts, which increased interest income on the underlying assets $2,972, $1,983 and $978 in 2003, 2002 and 2001, respectively.
These amounts were substantially offset by corresponding decreases in the income earned on the underlying assets. Interest expense includes the impact of interest rate risk management contracts, which
(increased) decreased interest expense on the underlying liabilities $(305), $(141) and $63 in 2003, 2002 and 2001, respectively. These amounts were substantially offset by corresponding decreases
or increases in the interest paid on the underlying liabilities. For further information on interest rate contracts, see “Interest Rate Risk Management” beginning on page 52.
(3) Primarily consists of time deposits in denominations of $100,000 or more.
(4) Includes long-term debt related to Trust Securities.