Bank of America 2003 Annual Report Download - page 26
Download and view the complete annual report
Please find page 26 of the 2003 Bank of America annual report below. You can navigate through the pages in the report by either clicking on the pages listed below, or by using the keyword search tool below to find specific information within the annual report.-
 1
1 -
2
-
3
-
4
-
5
-
6
-
7
-
8
-
9
-
10
-
11
-
12
-
13
-
14
-
15
-
 16
16 -
 17
17 -
 18
18 -
 19
19 -
 20
20 -
 21
21 -
 22
22 -
 23
23 -
 24
24 -
 25
25 -
 26
26 -
 27
27 -
 28
28 -
 29
29 -
 30
30 -
 31
31 -
 32
32 -
 33
33 -
 34
34 -
 35
35 -
 36
36 -
37
-
38
-
39
-
40
-
41
-
42
-
43
-
44
-
45
-
46
-
47
-
48
-
49
-
50
-
51
-
52
-
53
-
54
-
55
-
56
-
57
-
58
-
59
-
60
-
61
 |
 |

recorded on our balance sheet after the revolving period of the securi-
tization, which has the effect of increasing loans on our balance sheet,
increasing net interest income and increasing charge-offs, with a cor-
responding reduction in noninterest income. Major factors driving the
remaining increase were continued seasoning of outstandings from
new credit card growth over the past two years and economic condi-
tions including higher bankruptcy filings. We expect the trend related to
the impact of the growth of seasoned credit card portfolio to continue.
As a matter of corporate practice, we do not discuss specific
client relationships; however, we have made an exception for two
names due to the publicity and interest surrounding them: Enron
Corporation and its related entities (Enron), and Parmalat. At
December 31, 2003 and 2002, our credit exposure related to Enron
was $102 million and $185 million respectively, of which $81 million
and $150 million was secured. Nonperforming loans related to Enron
were $78 million and $159 million at December 31, 2003 and 2002,
respectively. During 2003 and 2002, we charged off $58 million and
$48 million, respectively, related to Enron. Our credit exposure
related to Parmalat was $274 million and $617 million at December
31, 2003 and 2002, respectively, of which $123 million and $290
million was supported by credit insurance or collateralized by cash.
Our exposure at December 31, 2003 included both loans and deriv-
atives. Direct loans and letters of credit totaling $244 million con-
sisted of loans of $105 million that were supported by credit
insurance and $121 million that were not cash collateralized or credit
insured with specific reserves of $66 million, and undrawn letters of
credit collateralized by cash of $18 million. In addition, our exposure
also included derivatives of $30 million. Nonperforming loans related
to Parmalat were $226 million at December 31, 2003. There were no
nonperforming loans related to Parmalat at December 31, 2002. In
the fourth quarter of 2003, we exercised our contractual rights under
the credit agreements to repay $167 million of loans collateralized by
cash and retained $18 million of cash collateral that secured
undrawn letters of credit. We charged off $114 million of direct loans
that were not cash collateralized or credit insured. In addition, we
marked down the value of our derivatives by 75 percent, or $92 mil-
lion, resulting in the balance of $30 million at December 31, 2003.
Included in Other Assets are loans held for sale and leveraged
lease partnership interests of $8.4 billion and $332 million,
respectively, at December 31, 2003 and $13.8 billion and $387
million, respectively, at December 31, 2002. Included in these bal-
ances are nonperforming loans held for sale and leveraged lease
partnership interests of $199 million and $3 million, respectively,
at December 31, 2003 and $118 million and $2 million, respectively,
at December 31, 2002.
Allowance for Credit Losses
Loans and Le ase s
The allowance for loan and lease losses is allocated to each product
type based on specific and formula components, as well as a general
component. See Note 1 of the consolidated financial statements for
additional discussion on our allowance for credit losses.
The specific component of the allowance for loan and lease
losses covers those commercial loans that are nonperforming or
impaired. An allowance is established when the discounted cash
flows (or collateral value or observable market price) is lower than the
carrying value of that loan. For purposes of computing the specific loss
component of the allowance, larger impaired loans are evaluated
individually and smaller impaired loans are evaluated as a pool using
historical loss experience for the respective product type and risk
rating of the loan.
The formula component of the allocated allowance covers per-
forming commercial loans and leases, and consumer loans. The
allowance for commercial loans is established by product type by ana-
lyzing historical loss experience, by internal risk rating, current eco-
nomic conditions and performance trends within each portfolio
segment. The formula component allowance for consumer loans is
based on aggregated portfolio segment evaluations generally by prod-
uct type. Loss forecast models are utilized for consumer products that
consider a variety of factors including, but not limited to, historical loss
experience, estimated defaults or foreclosures based on portfolio
trends, delinquencies, economic trends and credit scores.
The general component of the allowance for loan and lease
losses is maintained to cover uncertainties that affect our estimate
of probable losses. These uncertainties include the imprecision
inherent in the forecasting methodologies, as well as domestic and
global economic uncertainty, large single name defaults or event risk.
We assess these components, among other current events and con-
ditions, to determine the overall level of the general component. The
relationship of the general component to the total allowance for
credit losses may fluctuate from period to period. We evaluate the
adequacy of the allowance for loan and lease losses based on the
combined total of specific, formula and general components.
We monitor differences between estimated and actual incurred
loan and lease losses. This monitoring process includes periodic
assessments by senior management of loan and lease portfolios and
the models used to estimate incurred losses in those portfolios.
Additions to the allowance for loan and lease losses are made
by charges to the provision. Credit exposures (excluding derivatives)
deemed to be uncollectible are charged against the allowance for
loan and lease losses. Recoveries of previously charged off amounts
are credited to the allowance for loan and lease losses.
Unfunde d Le nding Commitme nts
In addition to the allowance for loan and lease losses, we also com-
pute an estimate of probable losses related to unfunded lending
commitments, such as letters of credit and binding unfunded loan
commitments. This computation is similar to the methodology utilized
in calculating the allowance for commercial loans and leases with
specific, formula and general components, adjusted for the probabil-
ity of drawdown. The reserve for unfunded lending commitments is
included in accrued expenses and other liabilities on the
Consolidated Balance Sheet.
We monitor differences between estimated and actual incurred
credit losses. This monitoring process includes periodic assess-
ments by senior management of credit portfolios and the models
used to estimate incurred losses in those portfolios.
Additions to the reserve for unfunded lending commitments are
made by changes to the provision for unfunded lending commit-
ments. Credit exposures (excluding derivatives) deemed to be uncol-
lectible are charged against the reserve.
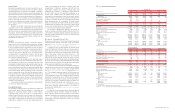
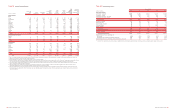
Table 16 presents a rollforward of the allowance for credit losses.
Table 16
Allowance for Credit Losses
(Dollars in millions)
2003 2002
Allowance for loan and lease
losses, January 1
$6,358 $6,278
Loans and leases charged off
Commercial – domestic
(989) (1,793)
Commercial – foreign
(408) (566)
Commercial real estate – domestic
(46) (45)
Total commercial
(1,443) (2,404)
Residential mortgage
(64) (56)
Home equity lines
(38) (40)
Direct/Indirect consumer
(322) (355)
Consumer finance
(280) (333)
Credit card
(1,657) (1,210)
Other consumer domestic
(57) (57)
Foreign consumer
(6) (5)
Total consumer
(2,424) (2,056)
Total loans and leases charged off
(3,867) (4,460)
Recoveries of loans and leases previously
charged off
Commercial – domestic
232 322
Commercial – foreign
102 45
Commercial real estate – domestic
58
Total commercial
339 375
Residential mortgage
24 14
Home equity lines
26 14
Direct/Indirect consumer
141 145
Consumer finance
68 78
Credit card
143 116
Other consumer domestic
19 21
Foreign consumer
1–
Total consumer
422 388
Total recoveries of loans and leases
previously charged off
761 763
Net charge-offs
(3,106) (3,697)
Provision for loan and lease losses
2,916 3,801
Other, net
(5) (24)
Allowance for loan and lease losses,
December 31
$6,163 $6,358
Reserve for unfunded lending commitments,
January 1
$493 $597
Provision for unfunded lending commitments
(77) (104)
Reserve for unfunded lending commitments,
December 31
$416 $493
Total
$6,579 $6,851
Loans and leases outstanding at December 31
$371,463 $342,755
Allowance for loan and lease losses as a
percentage of loans and leases outstanding
at December 31
1.66% 1.85%
Average loans and leases outstanding during
the year
$356,148 $336,819
Net charge-offs as a percentage of average
outstanding loans and leases during the year
0.87% 1.10%
Allowance for loan and lease losses as a
percentage of nonperforming loans at
December 31
215 126
Ratio of allowance for loan and lease losses
at December 31 to net charge-offs
1.98 1.72
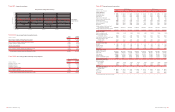
For reporting purposes, we allocate the allowance across products;
however, the allowance is available to absorb all credit losses without
restriction. Table 17 presents our allocation by product type.
Table 17
Allocation of the Allowance for Credit Losses
by Product Type
December 31
2003 2002
(Dollars in millions)
Amount Percent Amount Percent
Allowance for loan
and lease losses
Commercial – domestic
$1,420 21.6% $2,231 32.5%
Commercial – foreign
619 9.4 855 12.5
Commercial real estate
– domestic
404 6.2 430 6.3
Commercial real estate
– foreign
90.1 90.1
Total commercial(1)
2,452 37.3 3,525 51.4
Residential mortgage
149 2.3 108 1.6
Home equity lines
61 0.9 49 0.7
Direct/Indirect consumer
340 5.2 361 5.3
Consumer finance
376 5.7 323 4.7
Credit card
1,602 24.3 1,031 15.1
Foreign consumer
80.1 90.1
Total consumer
2,536 38.5 1,881 27.5
General
1,175 17.9 952 13.9
Allowance for loan
and lease losses
$6,163 93.7% $6,358 92.8%
Reserve for unfunded lending
commitments
Commercial – domestic
$80 1.2% $160 2.3%
Commercial – foreign
60 0.9 32 0.5
Commercial real estate
50.1 90.1
Total commercial
145 2.2 201 2.9
General
271 4.1 292 4.3
Reserve for unfunded
lending commitments
$416 6.3% $493 7.2%
Total
$6,579 100.0% $6,851 100.0%
(1) Includes commercial impaired loans of $391 and $919 at December 31, 2003 and 2002,
respectively.
During the third quarter of 2003, we updated historic loss rate factors
used in estimating the allowance for credit losses to incorporate
more current information.
The allowance for total commercial loan and lease losses
declined $1.1 billion to $2.5 billion as a result of improvement in
credit quality, reflected by the $8.7 billion and $2.1 billion decreases
in commercial criticized exposure and commercial nonperforming
assets; and a $13.9 billion reduction in commercial loans and leases
between December 31, 2003 and December 31, 2002. Specific
reserves on commercial impaired loans decreased $528 million, or
57 percent, in 2003, reflecting a decrease in our investment in
specific loans considered impaired of $1.9 billion to $2.1 billion at
December 31, 2003. The reduction in the levels of impaired loans
and the respective reserves resulted from the overall improvements
in commercial credit quality, loan sales, paydowns and payoffs largely
due to increased refinancings in the capital markets, and net charge-
offs. The allowance for loan and lease losses in the consumer port-
folio increased $655 million from December 31, 2002 due to
portfolio growth, new advances on previously securitized consumer
credit balances, continued seasoning of outstandings from new
consumer credit card growth and economic conditions including
48 BANK OF AMERICA 2003 BANK OF AMERICA 2003 49