Bank of America 2003 Annual Report Download - page 40
Download and view the complete annual report
Please find page 40 of the 2003 Bank of America annual report below. You can navigate through the pages in the report by either clicking on the pages listed below, or by using the keyword search tool below to find specific information within the annual report.-
 1
1 -
2
-
3
-
4
-
5
-
6
-
7
-
8
-
9
-
10
-
11
-
12
-
13
-
14
-
15
-
16
-
17
-
18
-
19
-
20
-
21
-
22
-
23
-
24
-
25
-
26
-
27
-
28
-
29
-
 30
30 -
 31
31 -
 32
32 -
 33
33 -
 34
34 -
 35
35 -
 36
36 -
 37
37 -
 38
38 -
 39
39 -
 40
40 -
 41
41 -
 42
42 -
 43
43 -
 44
44 -
 45
45 -
 46
46 -
 47
47 -
 48
48 -
 49
49 -
 50
50 -
51
-
52
-
53
-
54
-
55
-
56
-
57
-
58
-
59
-
60
-
61
 |
 |

76 BANK OF AMERICA 2003 BANK OF AMERICA 2003 77
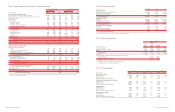
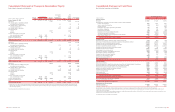
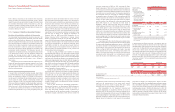
Consolidated Statement of Cash Flows
Bank of America Corporation and Subsidiaries
Year Ended December 31
(Dollars in millions)
2003 2002 2001
Operating activities
Net income
$10,810 $9,249 $ 6,792
Reconciliation of net income to net cash provided by (used in) operating activities:
Provision for credit losses
2,839 3,697 4,287
Gains on sales of debt securities
(941) (630) (475)
Business exit costs
––1,305
Depreciation and premises improvements amortization
890 886 854
Amortization of intangibles
217 218 878
Deferred income tax benefit
(263) (444) (385)
Net increase in trading and hedging instruments
(8,643) (12,357) (19,865)
Net (increase) decrease in other assets
7,176 (6,880) (14,336)
Net increase (decrease) in accrued expenses and other liabilities
12,067 (11,019) 5,106
Other operating activities, net
161 2,837 2,221
Net cash provided by (used in) operating activities
24,313 (14,443) (13,618)
Investing activities
Net increase in time deposits placed and other short-term investments
(1,238) (881) (484)
Net increase in federal funds sold and securities purchased under agreements to resell
(31,614) (16,770) (53)
Proceeds from sales of available-for-sale debt securities
171,711 137,702 125,824
Proceeds from maturities of available-for-sale debt securities
26,953 26,777 11,722
Purchases of available-for-sale debt securities
(195,868) (146,010) (126,537)
Proceeds from maturities of held-to-maturity debt securities
779 43 145
Proceeds from sales of loans and leases
32,672 28,068 10,781
Other changes in loans and leases, net
(74,202) (37,184) 18,201
Purchases and originations of mortgage banking assets
(1,637) (919) (1,148)
Net purchases of premises and equipment
(209) (939) (835)
Proceeds from sales of foreclosed properties
123 142 353
Investment in unconsolidated subsidiary
(1,600) ––
Acquisition of business activities, net
(140) (110) (417)
Other investing activities, net
845 2,695 1,007
Net cash provided by (used in) investing activities
(73,425) (7,386) 38,559
Financing activities
Net increase in deposits
27,655 12,963 9,251
Net increase (decrease) in federal funds purchased and securities sold under agreements to repurchase
12,967 17,352 (1,684)
Net increase (decrease) in commercial paper and other short-term borrowings
12,894 3,017 (19,981)
Proceeds from issuance of long-term debt and trust preferred securities
16,963 10,850 14,853
Retirement of long-term debt and trust preferred securities
(9,282) (15,364) (20,619)
Proceeds from issuance of common stock
3,970 2,373 1,019
Common stock repurchased
(9,766) (7,466) (4,716)
Cash dividends paid
(4,281) (3,709) (3,632)
Other financing activities, net
(72) (66) (51)
Net cash provided by (used in) financing activities
51,048 19,950 (25,560)
Effect of exchange rate changes on cash and cash equivalents
175 15 (57)
Net increase (decrease) in cash and cash equivalents
2,111 (1,864) (676)
Cash and cash equivalents at January 1
24,973 26,837 27,513
Cash and cash equivalents at December 31
$27,084 $24,973 $26,837
Supplemental cash flow disclosures
Cash paid for interest
$10,214 $11,253 $19,257
Cash paid for income taxes
3,870 3,999 3,121
Net consolidation of assets and liabilities of certain multi-seller asset-backed commercial paper conduits amounted to $4,350, $0 and $0 in 2003, 2002 and 2001, respectively.
Net transfers of loans and leases from loans held for sale (included in other assets) to the loan portfolio for Asset and Liability Management (ALM) purposes amounted to $9,683, $8,468 and $247
in 2003, 2002 and 2001, respectively.
There were no loans and loans held for sale securitized and retained in the available-for-sale debt securities portfolio in 2003 and 2002. Loans and loans held for sale securitized and retained in the avail-
able-for-sale debt securities portfolio amounted to $29,985 in 2001.
See accompanying notes to consolidated financial statements.
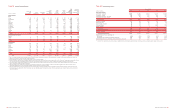
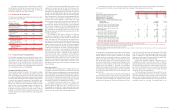
Consolidated Statement of Changes in Shareholders’ Equity
Bank of America Corporation and Subsidiaries
Accumulated Total
Other Share-
Preferred Common Stock Retained Comprehensive holders’ Comprehensive
(Dollars in millions, shares in thousands)
Stock Shares Amount Earnings Income (Loss)(1) Other Equity Income
Balance, December 31, 2000
$72 1,613,632 $ 8,613 $ 39,815 $ (746) $ (126) $ 47,628
Net income 6,792
6,792 $ 6,792
Net unrealized gains on available-for-sale debt
and marketable equity securities
80 80 80
Net unrealized gains on foreign currency
translation adjustments
15 15 15
Net unrealized gains on derivatives
1,088 1,088 1,088
Cash dividends paid:
Common (3,627)
(3,627)
Preferred (5)
(5)
Common stock issued under employee
plans and related tax benefits
27,301 1,059 62 1,121
Common stock repurchased
(81,939) (4,716) (4,716)
Conversion of preferred stock
(7) 298 7
Other 5
113 5 26 144
Balance, December 31, 2001
$65 1,559,297 $ 5,076 $ 42,980 $ 437 $ (38) $ 48,520 $
7,975
Net income 9,249
9,249 $ 9,249
Net unrealized gains on available-for-sale debt
and marketable equity securities
974 974 974
Net unrealized gains on foreign currency
translation adjustments
333
Net unrealized losses on derivatives
(93) (93) (93)
Cash dividends paid:
Common
(3,704) (3,704)
Preferred
(5) (5)
Common stock issued under employee
plans and related tax benefits
50,004 2,611 21 2,632
Common stock repurchased
(108,900) (7,466) (7,466)
Conversion of preferred stock
(7) 265 7
Other 25
268 (3) (89) 33 209 (89)
Balance, December 31, 2002
$58 1,500,691 $ 496 $ 48,517 $ 1,232 $ 16 $ 50,319 $
10,044
Net income
10,810 10,810 $ 10,810
Net unrealized losses on available-for-sale debt
and marketable equity securities
(564) (564) (564)
Net unrealized gains on foreign currency
translation adjustments
222
Net unrealized losses on derivatives
(2,803) (2,803) (2,803)
Cash dividends paid:
Common
(4,277) (4,277)
Preferred
(4) (4)
Common stock issued under employee
plans and related tax benefits
69,649 4,372 (123) 4,249
Common stock repurchased
(129,343) (4,936) (4,830) (9,766)
Conversion of preferred stock
(4) 147 4
Other
78 (3) (15) (46) 14 (15)
Balance, December 31, 2003
$54 1,441,144 $ 14 $ 50,213 $ (2,148) $ (153) $ 47,980 $ 7,430
(1) At December 31, 2003, 2002, and 2001, Accumulated Other Comprehensive Income (Loss) includes net unrealized gains (losses) on available-for-sale debt and marketable equity securities of $(70),
$494 and $(480), respectively; net unrealized losses on foreign currency translation adjustments of $166, $168 and $171, respectively; and net unrealized gains (losses) on derivatives of $(1,808),
$995 and $1,088, respectively.
See accompanying notes to consolidated financial statements.