Bank of America 2003 Annual Report Download - page 16
Download and view the complete annual report
Please find page 16 of the 2003 Bank of America annual report below. You can navigate through the pages in the report by either clicking on the pages listed below, or by using the keyword search tool below to find specific information within the annual report.-
 1
1 -
2
-
3
-
4
-
5
-
 6
6 -
 7
7 -
 8
8 -
 9
9 -
 10
10 -
 11
11 -
 12
12 -
 13
13 -
 14
14 -
 15
15 -
 16
16 -
 17
17 -
 18
18 -
 19
19 -
 20
20 -
 21
21 -
 22
22 -
 23
23 -
 24
24 -
 25
25 -
 26
26 -
27
-
28
-
29
-
30
-
31
-
32
-
33
-
34
-
35
-
36
-
37
-
38
-
39
-
40
-
41
-
42
-
43
-
44
-
45
-
46
-
47
-
48
-
49
-
50
-
51
-
52
-
53
-
54
-
55
-
56
-
57
-
58
-
59
-
60
-
61
 |
 |

BANK OF AMERICA 2003 29
Supplemental Financial Data
In managing our business, we use certain performance measures
and ratios not defined in accounting principles generally accepted in
the United States (GAAP), including financial information on an oper-
ating basis and shareholder value added (SVA). We also calculate
certain measures, such as net interest income, core net interest
income, net interest yield and the efficiency ratio, on a fully taxable-
equivalent basis. Other companies may define or calculate supple-
mental financial data differently. See Table 2 for supplemental
financial data and corresponding reconciliations to GAAP financial
measures for the five most recent years.
Supplemental financial data presented on an operating basis is
a basis of presentation not defined by GAAP that excludes exit, and
merger and restructuring charges. Table 2 includes earnings, earn-
ings per common share (EPS), SVA, return on average assets, return
on average equity, efficiency ratio and dividend payout ratio presented
on an operating basis. We believe that the exclusion of the exit, and
merger and restructuring charges, which represent events outside of
our normal operations, provides a meaningful period-to-period com-
parison and is more reflective of normalized operations.
SVA is a key measure of performance not defined by GAAP,that
is used in managing our growth strategy orientation and strengthen-
ing our focus on generating long-term growth and shareholder value.
SVA is used in measuring the performance of our different business
units and is an integral component for allocating resources. Each
business segment has a goal for growth in SVA reflecting the individ-
ual segment’s business and customer strategy. Investment resources
and initiatives are aligned with these SVA growth goals during the
planning and forecasting process. Investment, relationship and prof-
itability models all have SVA as a key measure to support the imple-
mentation of SVA growth goals. SVA is defined as cash basis
earnings on an operating basis less a charge for the use of capital.
Cash basis earnings is defined as net income adjusted to exclude
amortization of intangibles. The charge for the use of capital is cal-
culated by multiplying 11 percent (management’s estimate of the
shareholders’ minimum required rate of return on capital invested) by
average total common shareholders’ equity at the corporate level and
by average allocated equity at the business segment level. Equity is
allocated to the business segments using a risk-adjusted methodol-
ogy for each segment’s credit, market and operational risks. The
nature of these risks is discussed further beginning on page 44. SVA
increased 49 percent to $5.6 billion for 2003 compared to 2002, due
to both the $1.6 billion increase in cash basis earnings and the $491
million effect of the decrease in the capital charge, which was driven
by a reduction in management’s estimate of the rate used to calcu-
late the charge for the use of capital from 12 percent to 11 percent
in 2003. For additional discussion of SVA, see Business Segment
Operations beginning on page 32.
We review net interest income on a fully taxable-equivalent
basis, which is a performance measure used by management in oper-
ating the business that we believe provides investors with a more
accurate picture of the interest margin for comparative purposes. In
this presentation, net interest income is adjusted to reflect tax-
exempt interest income on an equivalent before-tax basis. For pur-
poses of this calculation, we use the federal statutory tax rate of 35
percent. This measure ensures comparability of net interest income
arising from both taxable and tax-exempt sources. Net interest
income on a fully taxable-equivalent basis is also used in the calcu-
lation of the efficiency ratio and the net interest yield. The efficiency
ratio, which is calculated by dividing noninterest expense by total rev-
enue, measures how much it costs to produce one dollar of revenue.
Net interest income on a fully taxable-equivalent basis is also used
in our business segment reporting.
Additionally, we review “core net interest income,” which adjusts
reported net interest income on a fully taxable-equivalent basis for the
impact of Global Corporate and Inve stme nt Banking trading-related
activities and loans that we originated and sold into revolving credit
card and commercial securitizations. Noninterest income, rather than
net interest income and provision for credit losses, is recorded for
assets that have been securitized as we are compensated for servic-
ing the securitized assets and record servicing income and gains or
losses on securitizations, where appropriate. We evaluate our trading
results by combining trading-related net interest income with trading
account profits, as discussed in the Global Corporate and Inve stme nt
Banking business segment section beginning on page 36, as trading
strategies are evaluated based on total revenue.
Core net interest income increased $147 million in 2003. This
increase was driven by higher ALM portfolio levels, consumer loan lev-
els, higher mortgage warehouse and core deposit funding levels.
These increases were partially offset by the impact of lower interest
rates and reductions in the large corporate, foreign and exited con-
sumer loan portfolios.
Core average earning assets increased $24.7 billion in 2003,
driven by the $29.9 billion increase in residential mortgages related
to ALM activities during the year and the $6.8 billion increase in credit
card outstandings, which includes $2.6 billion of new advances under
previously securitized balances that are recorded on our balance
sheet, after the revolving period of the securitization, partially offset by
the $16.0 billion decrease in the overall commercial loan portfolio.
The core net interest yield decreased 19 bps in 2003, mainly due
to the results of our ALM process partially offset by consumer loan
growth, primarily credit cards, that was experienced throughout the year.
28 BANK OF AMERICA 2003
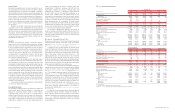
Table 2
Supplemental Financial Data and Reconciliations to GAAP Financial Measures
(Dollars in millions, except per share information) 2003 2002 2001 2000 1999
Operating basis(1,2)
Operating earnings
$10,810 $9,249 $ 8,042 $ 7,863 $ 8,240
Operating earnings per common share
7.27 6.08 5.04 4.77 4.77
Diluted operating earnings per common share
7.13 5.91 4.95 4.72 4.68
Shareholder value added
5,621 3,760 3,087 3,081 3,544
Return on average assets
1.41% 1.40% 1.24% 1.17% 1.34%
Return on average common shareholders’ equity
21.99 19.44 16.53 16.70 17.70
Efficiency ratio (fully taxable-equivalent basis)
52.23 52.55 55.47 54.38 55.30
Dividend payout ratio
39.58 40.07 45.13 43.04 38.77
Net interest income
Fully taxable-equivalent basis data
Net interest income
$22,107 $21,511 $ 20,633 $ 18,671 $ 18,342
Total revenue
38,529 35,082 34,981 33,253 32,521
Net interest yield
3.36% 3.75% 3.68% 3.20% 3.45%
Efficiency ratio
52.23 52.55 59.20 56.03 56.92
Core basis data
Core net interest income
$20,205 $20,058 $ 19,719 $ 18,546 $ 18,583
Core average earning assets
478,815 454,157 468,317 506,898 472,329
Core net interest yield
4.22% 4.41% 4.21% 3.66% 3.93%
Reconciliation of net income to operating earnings
Net income
$10,810 $9,249 $ 6,792 $ 7,517 $ 7,882
Exit charges
––1,700 – –
Merger and restructuring charges
–––550 525
Related income tax benefit
––(450) (204) (167)
Operating earnings
$10,810 $9,249 $ 8,042 $ 7,863 $ 8,240
Reconciliation of EPS to operating EPS
Earnings per common share
$7.27 $6.08 $ 4.26 $ 4.56 $ 4.56
Exit charges, net of tax benefit
––0.78 – –
Merger and restructuring charges, net of tax benefit
–––0.21 0.21
Operating earnings per common share
$7.27 $6.08 $ 5.04 $ 4.77 $ 4.77
Reconciliation of diluted EPS to diluted operating EPS
Diluted earnings per common share
$7.13 $5.91 $ 4.18 $ 4.52 $ 4.48
Exit charges, net of tax benefit
––0.77 – –
Merger and restructuring charges, net of tax benefit
–––0.20 0.20
Diluted operating earnings per common share
$7.13 $5.91 $ 4.95 $ 4.72 $ 4.68
Reconciliation of net income to shareholder value added
Net income
$10,810 $9,249 $ 6,792 $ 7,517 $ 7,882
Amortization of intangibles
217 218 878 864 888
Exit charges, net of tax benefit
––1,250 – –
Merger and restructuring charges, net of tax benefit
–––346 358
Cash basis earnings on an operating basis
11,027 9,467 8,920 8,727 9,128
Capital charge
(5,406) (5,707) (5,833) (5,646) (5,584)
Shareholder value added
$5,621 $3,760 $ 3,087 $ 3,081 $ 3,544
Reconciliation of return on average assets to operating
return on average assets
Return on average assets
1.41% 1.40% 1.05% 1.12% 1.28%
Effect of exit charges, net of tax benefit
––0.19 – –
Effect of merger and restructuring charges, net of tax benefit
–––0.05 0.06
Operating return on average assets
1.41% 1.40% 1.24% 1.17% 1.34%
Reconciliation of return on average common shareholders’ equity
to operating return on average common shareholders’ equity
Return on average common shareholders’ equity
21.99% 19.44% 13.96% 15.96% 16.93%
Effect of exit charges, net of tax benefit
––2.57 – –
Effect of merger and restructuring charges, net of tax benefit
–––0.74 0.77
Operating return on average common shareholders’ equity
21.99% 19.44% 16.53% 16.70% 17.70%
Reconciliation of efficiency ratio to operating efficiency ratio
(fully taxable-equivalent basis)
Efficiency ratio
52.23% 52.55% 59.20% 56.03% 56.92%
Effect of exit charges, net of tax benefit
––(3.73) – –
Effect of merger and restructuring charges, net of tax benefit
–––(1.65) (1.62)
Operating efficiency ratio
52.23% 52.55% 55.47% 54.38% 55.30%
Reconciliation of dividend payout ratio to operating dividend payout ratio
Dividend payout ratio
39.58% 40.07% 53.44% 45.02% 40.54%
Effect of exit charges, net of tax benefit
––(8.31) – –
Effect of merger and restructuring charges, net of tax benefit
–––(1.98) (1.77)
Operating dividend payout ratio
39.58% 40.07% 45.13% 43.04% 38.77%
(1) Operating basis excludes exit, and merger and restructuring charges. Exit charges in 2001 represented provision for credit losses of $395 and noninterest expense of $1,305, both of which were related
to the exit of certain consumer finance businesses. Merger and restructuring charges were $550 and $525 in 2000 and 1999, respectively.
(2) As a result of the adoption of SFAS 142 on January 1, 2002, we no longer amortize goodwill. Goodwill amortization expense was $662, $635 and $635 in 2001, 2000 and 1999, respectively.