Humana 2006 Annual Report Download - page 103
Download and view the complete annual report
Please find page 103 of the 2006 Humana annual report below. You can navigate through the pages in the report by either clicking on the pages listed below, or by using the keyword search tool below to find specific information within the annual report.-
 1
1 -
2
-
3
-
4
-
5
-
6
-
7
-
8
-
9
-
10
-
11
-
12
-
13
-
14
-
15
-
16
-
17
-
18
-
19
-
20
-
21
-
22
-
23
-
24
-
25
-
26
-
27
-
28
-
29
-
30
-
31
-
32
-
33
-
34
-
35
-
36
-
37
-
38
-
39
-
40
-
41
-
42
-
43
-
44
-
45
-
46
-
47
-
48
-
49
-
50
-
51
-
52
-
53
-
54
-
55
-
56
-
57
-
58
-
59
-
60
-
61
-
62
-
63
-
64
-
65
-
66
-
67
-
68
-
69
-
70
-
71
-
72
-
73
-
74
-
75
-
76
-
77
-
78
-
79
-
80
-
81
-
82
-
83
-
84
-
85
-
86
-
87
-
88
-
89
-
90
-
91
-
92
-
 93
93 -
 94
94 -
 95
95 -
 96
96 -
 97
97 -
 98
98 -
 99
99 -
 100
100 -
 101
101 -
 102
102 -
 103
103 -
 104
104 -
 105
105 -
 106
106 -
 107
107 -
 108
108 -
 109
109 -
 110
110 -
 111
111 -
 112
112 -
 113
113 -
114
-
115
-
116
-
117
-
118
-
119
-
120
-
121
-
122
-
123
-
124
-
125
-
126
 |
 |

Humana Inc.
NOTES TO CONSOLIDATED FINANCIAL STATEMENTS—(Continued)
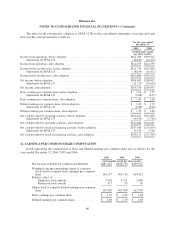
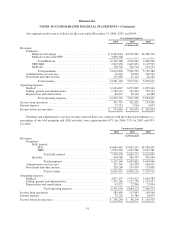
Our segment results were as follows for the years ended December 31, 2006, 2005, and 2004:
Government Segment
2006 2005 2004
(in thousands)
Revenues:
Premiums:
Medicare Advantage .................................. $ 8,499,064 $4,590,362 $3,086,598
Medicare stand-alone PDP ............................. 3,050,304 — —
Total Medicare .................................. 11,549,368 4,590,362 3,086,598
TRICARE .......................................... 2,543,930 2,407,653 2,127,595
Medicaid ........................................... 520,520 548,714 511,193
Total premiums .................................. 14,613,818 7,546,729 5,725,386
Administrative services fees ................................ 49,442 50,059 106,764
Investment and other income ............................... 117,858 21,123 26,261
Total revenues ................................... 14,781,118 7,617,911 5,858,411
Operating expenses:
Medical ................................................ 12,424,047 6,272,045 4,825,064
Selling, general and administrative ........................... 1,730,243 963,354 715,299
Depreciation and amortization .............................. 85,071 56,310 44,488
Total operating expenses .......................... 14,239,361 7,291,709 5,584,851
Income from operations ....................................... 541,757 326,202 273,560
Interest expense .............................................. 27,912 9,526 4,497
Income before income taxes .................................... $ 513,845 $ 316,676 $ 269,063
Premium and administrative services revenues derived from our contracts with the federal government, as a
percentage of our total premium and ASO revenues, were approximately 67% for 2006, 51% for 2005 and 43%
for 2004.
Commercial Segment
2006 2005 2004
(in thousands)
Revenues:
Premiums:
Fully insured:
PPO ............................................ $3,684,442 $3,635,347 $3,786,501
HMO ........................................... 2,019,936 2,432,768 2,827,981
Total fully insured ............................. 5,704,378 6,068,115 6,614,482
Specialty ............................................ 410,986 386,747 349,564
Total premiums ............................... 6,115,364 6,454,862 6,964,046
Administrative services fees ................................. 291,769 209,378 166,032
Investment and other income ................................ 228,286 135,976 115,836
Total revenues ................................ 6,635,419 6,800,216 7,245,914
Operating expenses:
Medical ................................................. 4,997,157 5,379,425 5,844,583
Selling, general and administrative ............................ 1,291,266 1,232,250 1,179,037
Depreciation and amortization ............................... 63,527 72,548 73,304
Total operating expenses ....................... 6,351,950 6,684,223 7,096,924
Income from operations ........................................ 283,469 115,993 148,990
Interest expense ............................................... 35,229 29,789 18,675
Income before income taxes ..................................... $ 248,240 $ 86,204 $ 130,315
91