Humana 2006 Annual Report Download - page 86
Download and view the complete annual report
Please find page 86 of the 2006 Humana annual report below. You can navigate through the pages in the report by either clicking on the pages listed below, or by using the keyword search tool below to find specific information within the annual report.-
 1
1 -
2
-
3
-
4
-
5
-
6
-
7
-
8
-
9
-
10
-
11
-
12
-
13
-
14
-
15
-
16
-
17
-
18
-
19
-
20
-
21
-
22
-
23
-
24
-
25
-
26
-
27
-
28
-
29
-
30
-
31
-
32
-
33
-
34
-
35
-
36
-
37
-
38
-
39
-
40
-
41
-
42
-
43
-
44
-
45
-
46
-
47
-
48
-
49
-
50
-
51
-
52
-
53
-
54
-
55
-
56
-
57
-
58
-
59
-
60
-
61
-
62
-
63
-
64
-
65
-
66
-
67
-
68
-
69
-
70
-
71
-
72
-
73
-
74
-
75
-
 76
76 -
 77
77 -
 78
78 -
 79
79 -
 80
80 -
 81
81 -
 82
82 -
 83
83 -
 84
84 -
 85
85 -
 86
86 -
 87
87 -
 88
88 -
 89
89 -
 90
90 -
 91
91 -
 92
92 -
 93
93 -
 94
94 -
 95
95 -
 96
96 -
97
-
98
-
99
-
100
-
101
-
102
-
103
-
104
-
105
-
106
-
107
-
108
-
109
-
110
-
111
-
112
-
113
-
114
-
115
-
116
-
117
-
118
-
119
-
120
-
121
-
122
-
123
-
124
-
125
-
126
 |
 |

Humana Inc.
NOTES TO CONSOLIDATED FINANCIAL STATEMENTS—(Continued)
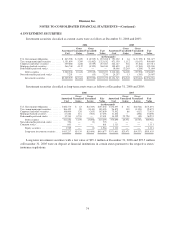
4. INVESTMENT SECURITIES
Investment securities classified as current assets were as follows at December 31, 2006 and 2005:
2006 2005
Amortized
Cost
Gross
Unrealized
Gains
Gross
Unrealized
Losses
Fair
Value
Amortized
Cost
Gross
Unrealized
Gains
Gross
Unrealized
Losses
Fair
Value
(in thousands)
U.S. Government obligations ........... $ 843,798 $ 2,029 $ (8,539) $ 837,288 $ 791,322 $ 84 $ (9,729) $ 781,677
Tax exempt municipal securities ........ 1,331,894 3,200 (11,462) 1,323,632 971,330 1,112 (11,637) 960,805
Corporate and other securities .......... 459,888 1,258 (3,559) 457,587 422,127 566 (9,182) 413,511
Mortgage-backed securities ............ 566,748 4,137 (4,355) 566,530 105,859 142 (2,761) 103,240
Redeemable preferred stocks ........... — — — — 19,668 52,285 (289) 71,664
Debt securities .................. 3,202,328 10,624 (27,915) 3,185,037 2,310,306 54,189 (33,598) 2,330,897
Non-redeemable preferred stocks ....... 7,251 — (15) 7,236 24,237 13 (243) 24,007
Investment securities ............. $3,209,579 $10,624 $(27,930) $3,192,273 $2,334,543 $54,202 $(33,841) $2,354,904
Investment securities classified as long-term assets were as follows at December 31, 2006 and 2005:
2006 2005
Amortized
Cost
Gross
Unrealized
Gains
Gross
Unrealized
Losses
Fair
Value
Amortized
Cost
Gross
Unrealized
Gains
Gross
Unrealized
Losses
Fair
Value
(in thousands)
U.S. Government obligations .......... $156,770 $ 63 $(1,789) $155,044 $174,397 $ 36 $(2,542) $171,891
Tax exempt municipal securities ........ 106,453 90 (1,140) 105,403 96,875 119 (1,123) 95,871
Corporate and other securities .......... 108,004 120 (265) 107,859 73,562 88 (617) 73,033
Mortgage-backed securities ........... 27,684 116 (304) 27,496 11,104 — (206) 10,898
Redeemable preferred stocks .......... 12,741 4,750 — 17,491 14,552 23,728 (49) 38,231
Debt securities .................. 411,652 5,139 (3,498) 413,293 370,490 23,971 (4,537) 389,924
Non-redeemable preferred stocks ....... 724 — (1) 723 — — — —
Common stocks ..................... 861 — — 861 1,111 — — 1,111
Equity securities ................ 1,585 — (1) 1,584 1,111 — — 1,111
Long-term investment securities .... $413,237 $5,139 $(3,499) $414,877 $371,601 $23,971 $(4,537) $391,035
Long-term investment securities with a fair value of $99.1 million at December 31, 2006 and $93.5 million
at December 31, 2005 were on deposit at financial institutions in certain states pursuant to the respective states’
insurance regulations.
74