Humana 2006 Annual Report Download - page 97
Download and view the complete annual report
Please find page 97 of the 2006 Humana annual report below. You can navigate through the pages in the report by either clicking on the pages listed below, or by using the keyword search tool below to find specific information within the annual report.-
 1
1 -
2
-
3
-
4
-
5
-
6
-
7
-
8
-
9
-
10
-
11
-
12
-
13
-
14
-
15
-
16
-
17
-
18
-
19
-
20
-
21
-
22
-
23
-
24
-
25
-
26
-
27
-
28
-
29
-
30
-
31
-
32
-
33
-
34
-
35
-
36
-
37
-
38
-
39
-
40
-
41
-
42
-
43
-
44
-
45
-
46
-
47
-
48
-
49
-
50
-
51
-
52
-
53
-
54
-
55
-
56
-
57
-
58
-
59
-
60
-
61
-
62
-
63
-
64
-
65
-
66
-
67
-
68
-
69
-
70
-
71
-
72
-
73
-
74
-
75
-
76
-
77
-
78
-
79
-
80
-
81
-
82
-
83
-
84
-
85
-
86
-
 87
87 -
 88
88 -
 89
89 -
 90
90 -
 91
91 -
 92
92 -
 93
93 -
 94
94 -
 95
95 -
 96
96 -
 97
97 -
 98
98 -
 99
99 -
 100
100 -
 101
101 -
 102
102 -
 103
103 -
 104
104 -
 105
105 -
 106
106 -
 107
107 -
108
-
109
-
110
-
111
-
112
-
113
-
114
-
115
-
116
-
117
-
118
-
119
-
120
-
121
-
122
-
123
-
124
-
125
-
126
 |
 |

Humana Inc.
NOTES TO CONSOLIDATED FINANCIAL STATEMENTS—(Continued)
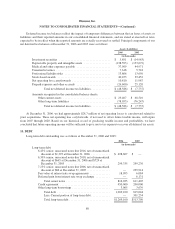
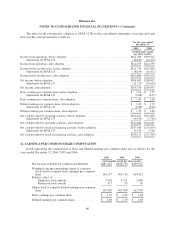
Restricted Stock Awards
Restricted stock awards are granted with a fair value equal to the market price of our common stock on the
date of grant. Compensation expense is recorded straight-line over the vesting period, generally three years from
the date of grant.
The weighted average grant date fair value of our restricted stock awards was $54.36, $32.81, and $24.77
for the years ended December 31, 2006, 2005, and 2004, respectively. Activity for our restricted stock awards
was as follows for the year ended December 31, 2006:
Shares
Weighted
Average
Grant-Date
Fair Value
Nonvested restricted stock at December 31, 2005 ............. 489,300 $32.92
Granted .......................................... 728,307 54.36
Vested ........................................... (41,665) 54.02
Forfeited ......................................... (68,487) 38.82
Nonvested restricted stock at December 31, 2006 ............. 1,107,455 $45.86
The fair value of shares vested during the years ended December 31, 2006, 2005, and 2004 was $2.3
million, $0.6 million, and $0.6 million, respectively. Total compensation expense related to nonvested restricted
stock awards not yet recognized was $26.9 million at December 31, 2006. We expect to recognize this
compensation expense over a weighted average period of approximately 1.8 years. There are no other contractual
terms covering restricted stock awards once vested.
Restrospective Application
We adopted SFAS 123R effective January 1, 2006. In accordance with the modified retrospective
application method, we have adjusted previously reported results to reflect the effect of expensing stock awards.
The cumulative effect adjustment for a change in accounting principle relating to the estimate of forfeitures on all
unvested awards at January 1, 2006 was immaterial and is included in compensation expense for the year ended
December 31, 2006. The following table illustrates the effect of the retrospective application on the beginning
balances of the specified balance sheet accounts as if the fair value method described in SFAS 123R had been
applied to all prior years for which the original provisions of SFAS 123 were effective.
As of
December 31,
2005
As of
December 31,
2004
(in thousands)
Other long-term liabilities (net deferred tax liability), before adoption ................ $ 662,129 $ 604,229
Adjustment for SFAS 123 ............................................... (34,769) (34,124)
Other long-term liabilities (net deferred tax liability), after adoption ................. $ 627,360 $ 570,105
Capital in excess of par value, before adoption .................................. $1,098,117 $1,017,156
Adjustment for SFAS 123 ............................................... 137,771 137,281
Capital in excess of par value, after adoption .................................... $1,235,888 $1,154,437
Retained earnings, before adoption ............................................ $1,538,306 $1,229,823
Adjustment for SFAS 123 ............................................... (116,631) (104,878)
Retained earnings, after adoption ............................................. $1,421,675 $1,124,945
85