Humana 2006 Annual Report Download - page 54
Download and view the complete annual report
Please find page 54 of the 2006 Humana annual report below. You can navigate through the pages in the report by either clicking on the pages listed below, or by using the keyword search tool below to find specific information within the annual report.-
 1
1 -
2
-
3
-
4
-
5
-
6
-
7
-
8
-
9
-
10
-
11
-
12
-
13
-
14
-
15
-
16
-
17
-
18
-
19
-
20
-
21
-
22
-
23
-
24
-
25
-
26
-
27
-
28
-
29
-
30
-
31
-
32
-
33
-
34
-
35
-
36
-
37
-
38
-
39
-
40
-
41
-
42
-
43
-
 44
44 -
 45
45 -
 46
46 -
 47
47 -
 48
48 -
 49
49 -
 50
50 -
 51
51 -
 52
52 -
 53
53 -
 54
54 -
 55
55 -
 56
56 -
 57
57 -
 58
58 -
 59
59 -
 60
60 -
 61
61 -
 62
62 -
 63
63 -
 64
64 -
65
-
66
-
67
-
68
-
69
-
70
-
71
-
72
-
73
-
74
-
75
-
76
-
77
-
78
-
79
-
80
-
81
-
82
-
83
-
84
-
85
-
86
-
87
-
88
-
89
-
90
-
91
-
92
-
93
-
94
-
95
-
96
-
97
-
98
-
99
-
100
-
101
-
102
-
103
-
104
-
105
-
106
-
107
-
108
-
109
-
110
-
111
-
112
-
113
-
114
-
115
-
116
-
117
-
118
-
119
-
120
-
121
-
122
-
123
-
124
-
125
-
126
 |
 |
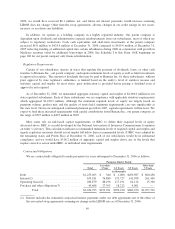
primarily due to the fact that we did not renew our participation in the Medicaid program for the State of Illinois
on July 31, 2005. The Illinois Medicaid business was not material to our results of operations, financial position,
or cash flows.
Commercial segment premium revenues decreased 7.3% to $6.5 billion for 2005, compared to $7.0 billion
for 2004. Lower premium revenues primarily resulted from a reduction of fully insured membership partially
offset by increases in average per member premiums. Our fully insured membership decreased 12.5%, or
286,700 members, to 1,999,800 at December 31, 2005 compared to 2,286,500 at December 31, 2004. The
decrease is primarily due to the relinquishment of an 89,000-member unprofitable account on January 1, 2005
and continued attrition due to the ongoing competitive environment within the fully insured group accounts,
partially offset by membership gains in the individual and consumer-choice product lines. Average per member
premiums for our fully insured group medical members increased approximately 7.4% in 2005.
Administrative Services Fees
Our administrative services fees for 2005 were $259.4 million, a decrease of $13.4 million, or 4.9%, from
$272.8 million for 2004.
Administrative services fees for the Government segment decreased $56.7 million, or 53.1%, from $106.8
million for 2004 to $50.1 million for 2005. This decline resulted from the transition to the new South Region
contract which carved out certain government programs including the administration of pharmacy and medical
benefits to senior members over the age of 65. We transitioned services under these separate programs to other
providers during 2004.
For the Commercial segment, administrative services fees increased $43.4 million, or 26.1%, from $166.0
million for 2004 to $209.4 million for 2005. This increase resulted from increased membership and higher
average per member fees. ASO membership of 1,171,000 members at December 31, 2005 increased 15.0%
compared to 1,018,600 at December 31, 2004. Average per member fees increased approximately 8% in 2005.
Investment Income
Investment income totaled $143.0 million in 2005, an increase of $10.2 million from $132.8 million in
2004. This increase primarily was attributable to higher interest rates and average invested balances offset by
lower capital gains. Net realized capital gains of $18.3 million in 2005 decreased $9.9 million from $28.2 million
in 2004. As of December 31, 2005, we had an unrealized gain of $52.3 million related to a venture capital
investment which was realized in the first quarter of 2006.
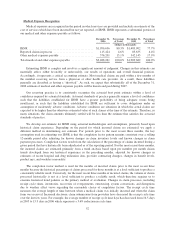
Medical Expense
Consolidated medical expenses increased $981.8 million or 9.2% during 2005. The increase was primarily
driven by the increase in average per member claims costs primarily from the effects of health care inflation and
incremental medical expenses related to the CarePlus acquisition.
The consolidated MER for 2005 was 83.2%, decreasing 90 basis points from 84.1% for 2004 due to
improvements in both the Commercial and Government segments as further discussed below. The 2005
consolidated MER includes 20 basis points for expenses associated with Hurricane Katrina.
The Government segment’s medical expenses increased $1.4 billion, or 30.0% during 2005 primarily due to
the increase in average per member claims costs and the increase in the number of Medicare Advantage
members, including those related to the CarePlus acquisition. The increase in average per member claims costs
for Medicare Advantage approximated 8% to 10% during 2005.
The Government segment’s MER for 2005 was 83.1%, a 120 basis point decrease from the 2004 rate of
84.3%. Excluding a 10 basis point increase in the 2005 MER from Hurricane Katrina, the decrease was primarily
42