Humana 2006 Annual Report Download - page 122
Download and view the complete annual report
Please find page 122 of the 2006 Humana annual report below. You can navigate through the pages in the report by either clicking on the pages listed below, or by using the keyword search tool below to find specific information within the annual report.-
 1
1 -
2
-
3
-
4
-
5
-
6
-
7
-
8
-
9
-
10
-
11
-
12
-
13
-
14
-
15
-
16
-
17
-
18
-
19
-
20
-
21
-
22
-
23
-
24
-
25
-
26
-
27
-
28
-
29
-
30
-
31
-
32
-
33
-
34
-
35
-
36
-
37
-
38
-
39
-
40
-
41
-
42
-
43
-
44
-
45
-
46
-
47
-
48
-
49
-
50
-
51
-
52
-
53
-
54
-
55
-
56
-
57
-
58
-
59
-
60
-
61
-
62
-
63
-
64
-
65
-
66
-
67
-
68
-
69
-
70
-
71
-
72
-
73
-
74
-
75
-
76
-
77
-
78
-
79
-
80
-
81
-
82
-
83
-
84
-
85
-
86
-
87
-
88
-
89
-
90
-
91
-
92
-
93
-
94
-
95
-
96
-
97
-
98
-
99
-
100
-
101
-
102
-
103
-
104
-
105
-
106
-
107
-
108
-
109
-
110
-
111
-
 112
112 -
 113
113 -
 114
114 -
 115
115 -
 116
116 -
 117
117 -
 118
118 -
 119
119 -
 120
120 -
 121
121 -
 122
122 -
 123
123 -
 124
124 -
 125
125 -
 126
126
 |
 |
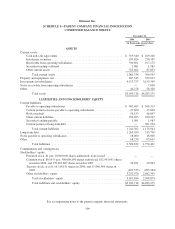
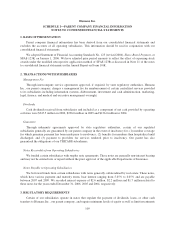
Humana Inc.
SCHEDULE I—PARENT COMPANY FINANCIAL INFORMATION
NOTES TO CONDENSED FINANCIAL STATEMENTS—(Continued)
to approved securities. The amount of dividends that may be paid to Humana Inc. by these subsidiaries, without
prior approval by state regulatory authorities, is limited based on the entity’s level of statutory income and
statutory capital and surplus. In most states, prior notification is provided before paying a dividend even if
approval is not required.
As of December 31, 2006, we maintained aggregate statutory capital and surplus of $2,066.0 million in our
state regulated subsidiaries. Each of these subsidiaries was in compliance with applicable statutory requirements
which aggregated $1,430.3 million. Although the minimum required levels of equity are largely based on
premium volume, product mix, and the quality of assets held, minimum requirements can vary significantly at
the state level.
Most states rely on risk-based capital requirements, or RBC, to define their required levels of equity
discussed above. RBC is a model developed by the National Association of Insurance Commissioners to monitor
an entity’s solvency. This calculation indicates recommended minimum levels of required capital and surplus and
signals regulatory measures should actual surplus fall below these recommended levels. If RBC were adopted by
the remaining states and Puerto Rico at December 31, 2006, each of our subsidiaries would be in substantial
compliance and we would have $516.2 million of aggregate capital and surplus above any of the levels that
require corrective action under RBC, or individual state requirements.
4. ACQUISITIONS
Refer to Note 3 of the notes to consolidated financial statements in the Annual Report on Form 10-K for a
description of acquisitions.
5. INCOME TAXES
The reduction in 2005 tax expense primarily related to the recognition of a $22.8 million contingent tax
benefit and associated $3.1 million reversal of accrued interest resulting from the resolution of an uncertain tax
position associated with the 2000 tax year during the first quarter of 2005 in connection with the expiration of the
statute of limitations. Refer to Note 9 of the notes to consolidated financial statements in the Annual Report on
Form 10-K for a description of income taxes.
110