Humana 2006 Annual Report Download - page 53
Download and view the complete annual report
Please find page 53 of the 2006 Humana annual report below. You can navigate through the pages in the report by either clicking on the pages listed below, or by using the keyword search tool below to find specific information within the annual report.-
 1
1 -
2
-
3
-
4
-
5
-
6
-
7
-
8
-
9
-
10
-
11
-
12
-
13
-
14
-
15
-
16
-
17
-
18
-
19
-
20
-
21
-
22
-
23
-
24
-
25
-
26
-
27
-
28
-
29
-
30
-
31
-
32
-
33
-
34
-
35
-
36
-
37
-
38
-
39
-
40
-
41
-
42
-
 43
43 -
 44
44 -
 45
45 -
 46
46 -
 47
47 -
 48
48 -
 49
49 -
 50
50 -
 51
51 -
 52
52 -
 53
53 -
 54
54 -
 55
55 -
 56
56 -
 57
57 -
 58
58 -
 59
59 -
 60
60 -
 61
61 -
 62
62 -
 63
63 -
64
-
65
-
66
-
67
-
68
-
69
-
70
-
71
-
72
-
73
-
74
-
75
-
76
-
77
-
78
-
79
-
80
-
81
-
82
-
83
-
84
-
85
-
86
-
87
-
88
-
89
-
90
-
91
-
92
-
93
-
94
-
95
-
96
-
97
-
98
-
99
-
100
-
101
-
102
-
103
-
104
-
105
-
106
-
107
-
108
-
109
-
110
-
111
-
112
-
113
-
114
-
115
-
116
-
117
-
118
-
119
-
120
-
121
-
122
-
123
-
124
-
125
-
126
 |
 |

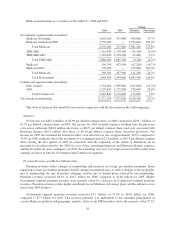
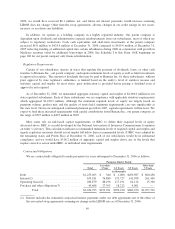
Medical membership was as follows at December 31, 2005 and 2004:
Change
2005 2004 Members Percentage
Government segment medical members:
Medicare Advantage ............................... 557,800 377,200 180,600 47.9%
Medicaid ........................................ 457,900 478,600 (20,700) (4.3)%
TRICARE ....................................... 1,750,900 1,789,400 (38,500) (2.2)%
TRICARE ASO ................................... 1,138,200 1,082,400 55,800 5.2%
Total TRICARE ............................... 2,889,100 2,871,800 17,300 0.6%
Total Government ......................... 3,904,800 3,727,600 177,200 4.8%
Commercial segment medical members:
Fully insured ..................................... 1,999,800 2,286,500 (286,700) (12.5)%
ASO ............................................ 1,171,000 1,018,600 152,400 15.0%
Total Commercial ......................... 3,170,800 3,305,100 (134,300) (4.1)%
Total medical membership .............................. 7,075,600 7,032,700 42,900 0.6%
This table of financial data should be reviewed in connection with the discussion on the following pages.
Summary
Net income was $296.7 million, or $1.79 per diluted common share, in 2005 compared to $269.9 million, or
$1.66 per diluted common share, in 2004. The increase in net income primarily resulted from improved profits in
our Government segment, driven by gains in Medicare Advantage membership and improved pretax results in
both our Medicare Advantage and TRICARE operations.
Net income for 2005 included expenses resulting from the class action litigation settlement ($44.8 million
after taxes, or $0.27 per diluted common share) and costs associated with Hurricane Katrina ($16.9 million after
taxes, or $0.10 per diluted common share). Net income for 2005 also included the favorable effect of an effective
tax rate of approximately 26.3% compared to 32.4% in 2004, primarily due to the resolution of a contingent tax
gain ($22.8 million, or $0.14 per diluted common share) during the first quarter of 2005 in connection with the
expiration of the statute of limitations on an uncertain tax position related to the 2000 tax year.
Premium Revenues and Medical Membership
Premium revenues increased 10.3% to $14.0 billion for 2005, compared to $12.7 billion for 2004. Higher
Government segment premium revenues were partially offset by a decrease in Commercial segment premium
revenues.
Government segment premium revenues increased 31.8% to $7.5 billion for 2005, compared to $5.7 billion
for 2004. This increase primarily was attributable to our Medicare Advantage operations and the effects of
transitioning to the TRICARE South Region contract during 2004. Medicare Advantage membership was
557,800 at December 31, 2005, compared to 377,200 at December 31, 2004, an increase of 180,600 members, or
47.9%. This increase was due to expanded participation in various Medicare Advantage programs and
geographic markets, as well as the CarePlus acquisition. The February 16, 2005 CarePlus acquisition added
50,400 members and $486.3 million in premium revenues in 2005. Average per member premiums for our
Medicare Advantage business increased approximately 12% during 2005. This reflects a shift in our Medicare
Advantage membership mix to higher reimbursement markets, due primarily to the South Florida CarePlus
acquisition. TRICARE premium revenues increased 13.2% in 2005, reflecting the transition to the new South
Region contract during 2004 which included a temporary loss of approximately 1 million members for 4 months
in 2004. Medicaid membership declined by 20,700 members from December 31, 2004 to December 31, 2005
41