Humana 2006 Annual Report Download - page 56
Download and view the complete annual report
Please find page 56 of the 2006 Humana annual report below. You can navigate through the pages in the report by either clicking on the pages listed below, or by using the keyword search tool below to find specific information within the annual report.-
 1
1 -
2
-
3
-
4
-
5
-
6
-
7
-
8
-
9
-
10
-
11
-
12
-
13
-
14
-
15
-
16
-
17
-
18
-
19
-
20
-
21
-
22
-
23
-
24
-
25
-
26
-
27
-
28
-
29
-
30
-
31
-
32
-
33
-
34
-
35
-
36
-
37
-
38
-
39
-
40
-
41
-
42
-
43
-
44
-
45
-
 46
46 -
 47
47 -
 48
48 -
 49
49 -
 50
50 -
 51
51 -
 52
52 -
 53
53 -
 54
54 -
 55
55 -
 56
56 -
 57
57 -
 58
58 -
 59
59 -
 60
60 -
 61
61 -
 62
62 -
 63
63 -
 64
64 -
 65
65 -
 66
66 -
67
-
68
-
69
-
70
-
71
-
72
-
73
-
74
-
75
-
76
-
77
-
78
-
79
-
80
-
81
-
82
-
83
-
84
-
85
-
86
-
87
-
88
-
89
-
90
-
91
-
92
-
93
-
94
-
95
-
96
-
97
-
98
-
99
-
100
-
101
-
102
-
103
-
104
-
105
-
106
-
107
-
108
-
109
-
110
-
111
-
112
-
113
-
114
-
115
-
116
-
117
-
118
-
119
-
120
-
121
-
122
-
123
-
124
-
125
-
126
 |
 |

Interest Expense
Interest expense was $39.3 million for 2005, compared to $23.2 million for 2004, an increase of $16.1
million. This increase primarily resulted from higher interest rates and higher average outstanding debt.
Income Taxes
Our effective tax rate in 2005 of 26.3% decreased 6.1% compared to the 32.4% effective tax rate in 2004.
The effective tax rate for 2005 reflects the favorable impact from the resolution of a contingent tax gain of $22.8
million during the first quarter of 2005 in connection with the expiration of the statute of limitations on an
uncertain tax position related to the 2000 tax year. See Note 9 to the consolidated financial statements included in
Item 8.—Financial Statements and Supplementary Data for a complete reconciliation of the federal statutory rate
to the effective tax rate.
Liquidity
Our primary sources of cash include receipts of premiums, ASO fees, CMS settlements, investment income,
as well as proceeds from the sale or maturity of our investment securities and from borrowings. Our primary uses
of cash include disbursements for claims payments, SG&A expenses, CMS settlements, interest expense, taxes,
purchases of investment securities, capital expenditures, acquisitions, and payments on borrowings. Because
premiums generally are collected in advance of claim payments by a period of up to several months in many
instances, our business should normally produce positive cash flows during a period of increasing enrollment.
Conversely, cash flows would be negatively impacted during a period of shrinking enrollment. We have recently
been experiencing improving operating cash flows associated with growth in Medicare enrollment. The use of
operating cash flows may be limited by regulatory requirements which require, among other items, that our
regulated subsidiaries maintain minimum levels of capital.
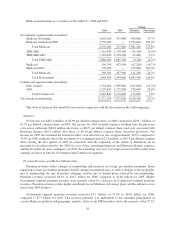
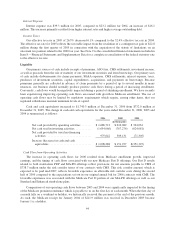
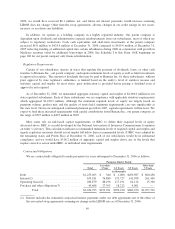
Cash and cash equivalents increased to $1,740.3 million at December 31, 2006 from $732.0 million at
December 31, 2005. The change in cash and cash equivalents for the years ended December 31, 2006, 2005 and
2004 is summarized as follows:
2006 2005 2004
(in thousands)
Net cash provided by operating activities ....... $1,686,712 $ 610,082 $ 344,061
Net cash used in investing activities ........... (1,654,066) (767,276) (624,081)
Net cash provided by (used in) financing
activities .............................. 975,642 309,131 (71,305)
Increase (decrease) in cash and cash
equivalents ............................. $1,008,288 $ 151,937 $(351,325)
Cash Flow from Operating Activities
The increase in operating cash flows for 2006 resulted from Medicare enrollment growth, improved
earnings, and the timing of cash flows associated with our new Medicare Part D offerings. Our Part D results
related to both stand-alone PDP and MA-PD offerings reflect provisions for net amounts payable to CMS of
$738.7 million under the risk corridor terms of our contracts with CMS. This risk corridor amount, which is
expected to be paid mid-2007, reflects favorable experience on allowable risk corridor costs during the second
half of 2006 compared to the expectations set out in our original annual bid for 2006 contracts with CMS. The
favorable experience was associated with the Medicare Part D portion of our MA-PD offerings as well as our
Standard and Enhanced stand-alone plans.
Comparisons of our operating cash flows between 2005 and 2004 were significantly impacted by the timing
of the Medicare premium remittance which is payable to us on the first day of each month. When the first day of
a month falls on a weekend or holiday, we historically received this payment at the end of the previous month.
As such, the Medicare receipt for January 2004 of $211.9 million was received in December 2003 because
January 1 is a holiday.
44