Humana 2006 Annual Report Download - page 24
Download and view the complete annual report
Please find page 24 of the 2006 Humana annual report below. You can navigate through the pages in the report by either clicking on the pages listed below, or by using the keyword search tool below to find specific information within the annual report.-
 1
1 -
2
-
3
-
4
-
5
-
6
-
7
-
8
-
9
-
10
-
11
-
12
-
13
-
 14
14 -
 15
15 -
 16
16 -
 17
17 -
 18
18 -
 19
19 -
 20
20 -
 21
21 -
 22
22 -
 23
23 -
 24
24 -
 25
25 -
 26
26 -
 27
27 -
 28
28 -
 29
29 -
 30
30 -
 31
31 -
 32
32 -
 33
33 -
 34
34 -
35
-
36
-
37
-
38
-
39
-
40
-
41
-
42
-
43
-
44
-
45
-
46
-
47
-
48
-
49
-
50
-
51
-
52
-
53
-
54
-
55
-
56
-
57
-
58
-
59
-
60
-
61
-
62
-
63
-
64
-
65
-
66
-
67
-
68
-
69
-
70
-
71
-
72
-
73
-
74
-
75
-
76
-
77
-
78
-
79
-
80
-
81
-
82
-
83
-
84
-
85
-
86
-
87
-
88
-
89
-
90
-
91
-
92
-
93
-
94
-
95
-
96
-
97
-
98
-
99
-
100
-
101
-
102
-
103
-
104
-
105
-
106
-
107
-
108
-
109
-
110
-
111
-
112
-
113
-
114
-
115
-
116
-
117
-
118
-
119
-
120
-
121
-
122
-
123
-
124
-
125
-
126
 |
 |

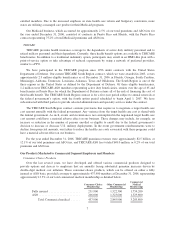
Medical membership under these various arrangements was as follows at December 31, 2006 and 2005:
Government Segment Commercial Segment
Total
Medical
Medicare
Advantage
Medicare
Stand-alone
PDP TRICARE
TRICARE
ASO Medicaid
Total
Segment
Fully
Insured ASO
Total
Segment
Medical Membership:
December 31, 2006
Capitated HMO
hospital system
based ......... 29,800 — — — — 29,800 33,600 — 33,600 63,400
Capitated HMO
physician group
based ......... 23,900 — — — 148,300 172,200 29,900 — 29,900 202,100
Risk-sharing ..... 279,300 — — — 239,700 519,000 25,900 — 25,900 544,900
Other ........... 669,600 3,536,600 1,716,400 1,163,600 181,100 7,267,300 1,664,800 1,529,600 3,194,400 10,461,700
Total ....... 1,002,600 3,536,600 1,716,400 1,163,600 569,100 7,988,300 1,754,200 1,529,600 3,283,800 11,272,100
December 31, 2005
Capitated HMO
hospital system
based ......... 35,200 — — — — 35,200 42,600 — 42,600 77,800
Capitated HMO
physician group
based ......... 23,300 — — — 170,400 193,700 39,500 — 39,500 233,200
Risk-sharing ..... 230,200 — — — 274,200 504,400 49,700 — 49,700 554,100
Other ........... 269,100 — 1,750,900 1,138,200 13,300 3,171,500 1,868,000 1,171,000 3,039,000 6,210,500
Total ....... 557,800 — 1,750,900 1,138,200 457,900 3,904,800 1,999,800 1,171,000 3,170,800 7,075,600
Medical Membership Distribution:
December 31, 2006
Capitated HMO
hospital system
based ......... 3.0% — — — — 0.4% 1.9% — 1.0% 0.6%
Capitated HMO
physician group
based ......... 2.4% — — — 26.1% 2.2% 1.7% — 0.9% 1.8%
Risk-sharing ..... 27.9% — — — 42.1% 6.4% 1.5% — 0.8% 4.8%
All other
membership . . . 66.7% 100.0% 100.0% 100.0% 31.8% 91.0% 94.9% 100.0% 97.3% 92.8%
Total ....... 100.0% 100.0% 100.0% 100.0% 100.0% 100.0% 100.0% 100.0% 100.0% 100.0%
December 31, 2005
Capitated HMO
hospital system
based ......... 6.3% — — — — 0.9% 2.1% — 1.3% 1.1%
Capitated HMO
physician group
based ......... 4.2% — — — 37.2% 5.0% 2.0% — 1.2% 3.3%
Risk-sharing ..... 41.3% — — — 59.9% 12.9% 2.5% — 1.6% 7.8%
All other
membership . . . 48.2% — 100.0% 100.0% 2.9% 81.2% 93.4% 100.0% 95.9% 87.8%
Total ....... 100.0% — 100.0% 100.0% 100.0% 100.0% 100.0% 100.0% 100.0% 100.0%
Capitation expense as a percentage of total medical expense was as follows for the years ended
December 31, 2006, 2005 and 2004:
2006 2005 2004
(dollars in thousands)
Medical Expenses:
Capitated HMO expense ............ $ 382,584 2.2% $ 456,123 3.9% $ 465,231 4.4%
Other medical expense ............. 17,038,620 97.8% 11,195,347 96.1% 10,204,416 95.6%
Consolidated medical expense . . . $17,421,204 100.0% $11,651,470 100.0% $10,669,647 100.0%
12