Humana 2006 Annual Report Download - page 70
Download and view the complete annual report
Please find page 70 of the 2006 Humana annual report below. You can navigate through the pages in the report by either clicking on the pages listed below, or by using the keyword search tool below to find specific information within the annual report.-
 1
1 -
2
-
3
-
4
-
5
-
6
-
7
-
8
-
9
-
10
-
11
-
12
-
13
-
14
-
15
-
16
-
17
-
18
-
19
-
20
-
21
-
22
-
23
-
24
-
25
-
26
-
27
-
28
-
29
-
30
-
31
-
32
-
33
-
34
-
35
-
36
-
37
-
38
-
39
-
40
-
41
-
42
-
43
-
44
-
45
-
46
-
47
-
48
-
49
-
50
-
51
-
52
-
53
-
54
-
55
-
56
-
57
-
58
-
59
-
 60
60 -
 61
61 -
 62
62 -
 63
63 -
 64
64 -
 65
65 -
 66
66 -
 67
67 -
 68
68 -
 69
69 -
 70
70 -
 71
71 -
 72
72 -
 73
73 -
 74
74 -
 75
75 -
 76
76 -
 77
77 -
 78
78 -
 79
79 -
 80
80 -
81
-
82
-
83
-
84
-
85
-
86
-
87
-
88
-
89
-
90
-
91
-
92
-
93
-
94
-
95
-
96
-
97
-
98
-
99
-
100
-
101
-
102
-
103
-
104
-
105
-
106
-
107
-
108
-
109
-
110
-
111
-
112
-
113
-
114
-
115
-
116
-
117
-
118
-
119
-
120
-
121
-
122
-
123
-
124
-
125
-
126
 |
 |

Duration is indicative of the relationship between changes in market value and changes in interest rates,
providing a general indication of the sensitivity of the fair values of our debt securities to changes in interest
rates. However, actual market values may differ significantly from estimates based on duration. The average
duration of our debt securities was approximately 3.3 years at December 31, 2006. Given that short term interest
rates were higher than long term rates during most of 2006, cash was invested in cash equivalents instead of
longer duration investment securities. Including cash equivalents, the average duration lowers to 2.2 years. Based
on the duration including cash equivalents, a 1% increase in interest rates would generally decrease the fair value
of our securities by approximately $117 million.
Our investment securities are categorized as available for sale and, as a result, are stated at fair value. Fair
value of publicly traded debt and equity securities are based on quoted market prices. Non-traded debt securities
are priced independently by a third party vendor. Fair value of venture capital debt securities that are privately
held are estimated using a variety of valuation methodologies where an observable quoted market price does not
exist. Such methodologies include reviewing the value ascribed to the most recent financing, comparing the
security with securities of publicly traded companies in a similar line of business, and reviewing the underlying
financial performance including estimating discounted cash flows. Unrealized holding gains and losses, net of
applicable deferred taxes, are included as a component of stockholders’ equity and comprehensive income until
realized from a sale or impairment.
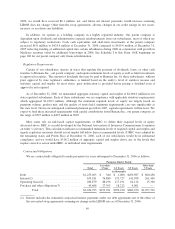
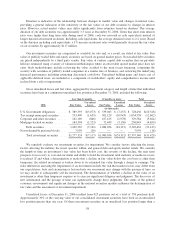
Gross unrealized losses and fair value, aggregated by investment category and length of time that individual
securities have been in a continuous unrealized loss position at December 31, 2006, included the following:
Less than 12 months 12 months or more Total
2006 Fair Value
Unrealized
Losses Fair Value
Unrealized
Losses Fair Value
Unrealized
Losses
(in thousands)
U.S. Government obligations ....... $ 389,393 $(3,073) $ 339,043 $ (7,255) $ 728,436 $(10,328)
Tax exempt municipal securities .... 533,409 (1,659) 501,129 (10,943) 1,034,538 (12,602)
Corporate and other securities ...... 162,169 (846) 167,415 (2,978) 329,584 (3,824)
Mortgage-backed securities ........ 184,394 (1,523) 72,449 (3,136) 256,843 (4,659)
Debt securities ............... 1,269,365 (7,101) 1,080,036 (24,312) 2,349,401 (31,413)
Non-redeemable preferred stocks .... 7,959 (16) — — 7,959 (16)
Total investment securities ..... $1,277,324 $(7,117) $1,080,036 $(24,312) $2,357,360 $(31,429)
We regularly evaluate our investment securities for impairment. We consider factors affecting the issuer,
factors affecting the industry the issuer operates within, and general debt and equity market trends. We consider
the length of time an investment’s fair value has been below cost, the severity of the decline, the near term
prospects for recovery to cost and our intent and ability to hold the investment until maturity or market recovery
is realized. If and when a determination is made that a decline in fair value below the cost basis is other than
temporary, the related investment is written down to its estimated fair value through a charge to earnings. The
risks inherent in assessing the impairment of an investment include the risk that market factors may differ from
our expectations; facts and circumstances factored into our assessment may change with the passage of time; or
we may decide to subsequently sell the investment. The determination of whether a decline in the value of an
investment is other than temporary requires us to exercise significant diligence and judgment. The discovery of
new information and the passage of time can significantly change these judgments. The status of the general
economic environment and significant changes in the national securities markets influence the determination of
fair value and the assessment of investment impairment.
Unrealized losses at December 31, 2006 resulted from 425 positions out of a total of 758 positions held.
Approximately 30% of the carrying value of our consolidated investment securities have been in an unrealized
loss position greater than one year. Of these investment securities in an unrealized loss position longer than a
58