Humana 2006 Annual Report Download - page 43
Download and view the complete annual report
Please find page 43 of the 2006 Humana annual report below. You can navigate through the pages in the report by either clicking on the pages listed below, or by using the keyword search tool below to find specific information within the annual report.-
 1
1 -
2
-
3
-
4
-
5
-
6
-
7
-
8
-
9
-
10
-
11
-
12
-
13
-
14
-
15
-
16
-
17
-
18
-
19
-
20
-
21
-
22
-
23
-
24
-
25
-
26
-
27
-
28
-
29
-
30
-
31
-
32
-
 33
33 -
 34
34 -
 35
35 -
 36
36 -
 37
37 -
 38
38 -
 39
39 -
 40
40 -
 41
41 -
 42
42 -
 43
43 -
 44
44 -
 45
45 -
 46
46 -
 47
47 -
 48
48 -
 49
49 -
 50
50 -
 51
51 -
 52
52 -
 53
53 -
54
-
55
-
56
-
57
-
58
-
59
-
60
-
61
-
62
-
63
-
64
-
65
-
66
-
67
-
68
-
69
-
70
-
71
-
72
-
73
-
74
-
75
-
76
-
77
-
78
-
79
-
80
-
81
-
82
-
83
-
84
-
85
-
86
-
87
-
88
-
89
-
90
-
91
-
92
-
93
-
94
-
95
-
96
-
97
-
98
-
99
-
100
-
101
-
102
-
103
-
104
-
105
-
106
-
107
-
108
-
109
-
110
-
111
-
112
-
113
-
114
-
115
-
116
-
117
-
118
-
119
-
120
-
121
-
122
-
123
-
124
-
125
-
126
 |
 |
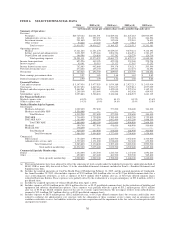
ITEM 7. MANAGEMENT’S DISCUSSION AND ANALYSIS OF FINANCIAL CONDITION AND
RESULTS OF OPERATIONS
The consolidated financial statements of Humana Inc. in this document present the Company’s financial
position, results of operations and cash flows, and should be read in conjunction with the following discussion
and analysis. References to “we,” “us,” “our,” “Company,” and “Humana” mean Humana Inc. and its
subsidiaries. This discussion includes forward-looking statements within the meaning of the Private Securities
Litigation Reform Act of 1995. When used in filings with the Securities and Exchange Commission, in our press
releases, investor presentations, and in oral statements made by or with the approval of one of our executive
officers, the words or phrases like “expects,” “anticipates,” “intends,” “likely will result,” “estimates,”
“projects” or variations of such words and similar expressions are intended to identify such forward–looking
statements. These forward–looking statements are not guarantees of future performance and are subject to risks,
uncertainties and assumptions, including, among other things, information set forth in Item 1A.—Risk Factors. In
making these statements, we are not undertaking to address or update these factors in future filings or
communications regarding our business or results except as required by law. In light of these risks, uncertainties
and assumptions, the forward–looking events discussed in this document might not occur. There may also be
other risks that we are unable to predict at this time. Any of these risks and uncertainties may cause actual
results to differ materially from the results discussed in the forward–looking statements.
Overview
Headquartered in Louisville, Kentucky, Humana Inc. is one of the nation’s largest publicly traded health
benefits companies, based on our 2006 revenues of $21.4 billion. We offer coordinated health insurance coverage
and related services through a variety of traditional and consumer-choice plans for government-sponsored
programs, employer groups, and individuals. As of December 31, 2006, we had approximately 11.3 million
members in our medical benefit programs, as well as approximately 1.9 million members in our specialty
products programs.
We manage our business with two segments: Government and Commercial. The Government segment
consists of members enrolled in government-sponsored programs, and includes three lines of business: Medicare,
TRICARE, and Medicaid. The Commercial segment consists of members enrolled in products marketed to
employer groups and individuals, and includes two lines of business: medical (fully and self insured) and
specialty. We identified our segments in accordance with the aggregation provisions of SFAS 131,which is
consistent with information used by our Chief Executive Officer in managing our business. The segment
information aggregates products with similar economic characteristics. These characteristics include the nature of
customer groups and pricing, benefits and underwriting requirements.
The results of each segment are measured by income before income taxes. We allocate all selling, general
and administrative expenses, investment and other income, interest expense, and goodwill, but no other assets or
liabilities, to our segments. Members served by our two segments often utilize the same medical provider
networks, enabling us to obtain more favorable contract terms with providers. Our segments also share overhead
costs and assets. As a result, the profitability of each segment is interdependent. We believe our customer,
membership, revenue and pretax income diversification across segments and products allows us to increase our
chances of success.
We adopted SFAS No. 123 (revised 2004), Share-Based Payment, or SFAS 123R, on January 1, 2006. We
have adjusted prior period amounts to reflect the effect of expensing stock awards under the modified
retrospective application method of SFAS 123R as discussed in Note 11 to the consolidated financial statements
included in Item 8.—Financial Statements and Supplementary Data.
Our results are impacted by many factors, but most notably are influenced by our ability to establish and
maintain a competitive and efficient cost structure and to accurately and consistently establish competitive
31