Humana 2006 Annual Report Download - page 41
Download and view the complete annual report
Please find page 41 of the 2006 Humana annual report below. You can navigate through the pages in the report by either clicking on the pages listed below, or by using the keyword search tool below to find specific information within the annual report.-
 1
1 -
2
-
3
-
4
-
5
-
6
-
7
-
8
-
9
-
10
-
11
-
12
-
13
-
14
-
15
-
16
-
17
-
18
-
19
-
20
-
21
-
22
-
23
-
24
-
25
-
26
-
27
-
28
-
29
-
30
-
 31
31 -
 32
32 -
 33
33 -
 34
34 -
 35
35 -
 36
36 -
 37
37 -
 38
38 -
 39
39 -
 40
40 -
 41
41 -
 42
42 -
 43
43 -
 44
44 -
 45
45 -
 46
46 -
 47
47 -
 48
48 -
 49
49 -
 50
50 -
 51
51 -
52
-
53
-
54
-
55
-
56
-
57
-
58
-
59
-
60
-
61
-
62
-
63
-
64
-
65
-
66
-
67
-
68
-
69
-
70
-
71
-
72
-
73
-
74
-
75
-
76
-
77
-
78
-
79
-
80
-
81
-
82
-
83
-
84
-
85
-
86
-
87
-
88
-
89
-
90
-
91
-
92
-
93
-
94
-
95
-
96
-
97
-
98
-
99
-
100
-
101
-
102
-
103
-
104
-
105
-
106
-
107
-
108
-
109
-
110
-
111
-
112
-
113
-
114
-
115
-
116
-
117
-
118
-
119
-
120
-
121
-
122
-
123
-
124
-
125
-
126
 |
 |

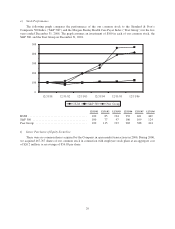
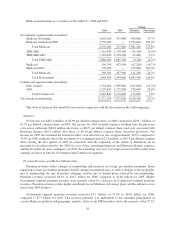
e) Stock Performance
The following graph compares the performance of the our common stock to the Standard & Poor’s
Composite 500 Index (“S&P 500”) and the Morgan Stanley Health Care Payer Index (“Peer Group”) for the five
years ended December 31, 2006. The graph assumes an investment of $100 in each of our common stock, the
S&P 500, and the Peer Group on December 31, 2001.
0
100
200
300
400
500
12/31/01
HUM S&P 500 Peer Group
12/31/02 12/31/03 12/31/04 12/31/05 12/31/06
12/31/01 12/31/02 12/31/03 12/31/04 12/31/05 12/31/06
HUM ........................................ 100 85 194 252 461 469
S&P500 ..................................... 100 77 97 106 109 124
Peer Group ................................... 100 115 193 283 388 414
f) Issuer Purchases of Equity Securities
There were no common shares acquired by the Company in open market transactions in 2006. During 2006,
we acquired 467,767 shares of our common stock in connection with employee stock plans at an aggregate cost
of $26.2 million, or an average of $56.03 per share.
29