Humana 2006 Annual Report Download - page 98
Download and view the complete annual report
Please find page 98 of the 2006 Humana annual report below. You can navigate through the pages in the report by either clicking on the pages listed below, or by using the keyword search tool below to find specific information within the annual report.-
 1
1 -
2
-
3
-
4
-
5
-
6
-
7
-
8
-
9
-
10
-
11
-
12
-
13
-
14
-
15
-
16
-
17
-
18
-
19
-
20
-
21
-
22
-
23
-
24
-
25
-
26
-
27
-
28
-
29
-
30
-
31
-
32
-
33
-
34
-
35
-
36
-
37
-
38
-
39
-
40
-
41
-
42
-
43
-
44
-
45
-
46
-
47
-
48
-
49
-
50
-
51
-
52
-
53
-
54
-
55
-
56
-
57
-
58
-
59
-
60
-
61
-
62
-
63
-
64
-
65
-
66
-
67
-
68
-
69
-
70
-
71
-
72
-
73
-
74
-
75
-
76
-
77
-
78
-
79
-
80
-
81
-
82
-
83
-
84
-
85
-
86
-
87
-
 88
88 -
 89
89 -
 90
90 -
 91
91 -
 92
92 -
 93
93 -
 94
94 -
 95
95 -
 96
96 -
 97
97 -
 98
98 -
 99
99 -
 100
100 -
 101
101 -
 102
102 -
 103
103 -
 104
104 -
 105
105 -
 106
106 -
 107
107 -
 108
108 -
109
-
110
-
111
-
112
-
113
-
114
-
115
-
116
-
117
-
118
-
119
-
120
-
121
-
122
-
123
-
124
-
125
-
126
 |
 |

Humana Inc.
NOTES TO CONSOLIDATED FINANCIAL STATEMENTS—(Continued)
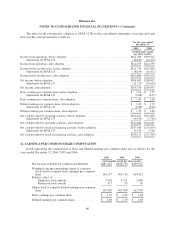
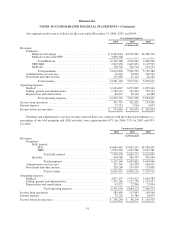
The effect of the retrospective adoption of SFAS 123R on the consolidated statements of income and cash
flows for the years presented is as follows:
For the years ended
December 31,
2005 2004
(in thousands, except
per share results)
Income from operations, before adoption ........................................... $461,029 $439,022
Adjustment for SFAS 123 ................................................... (18,834) (16,472)
Income from operations, after adoption ............................................. $442,195 $422,550
Income before income taxes, before adoption ........................................ $421,714 $415,850
Adjustment for SFAS 123 ................................................... (18,834) (16,472)
Income before income taxes, after adoption .......................................... $402,880 $399,378
Net income, before adoption ..................................................... $308,483 $280,012
Adjustment for SFAS 123 ................................................... (11,753) (10,065)
Net income, after adoption ....................................................... $296,730 $269,947
Basic earnings per common share, before adoption .................................... $ 1.91 $ 1.75
Adjustment for SFAS 123 ................................................... (0.08) (0.07)
Basic earnings per common share, after adoption ..................................... $ 1.83 $ 1.68
Diluted earnings per common share, before adoption .................................. $ 1.87 $ 1.72
Adjustment for SFAS 123 ................................................... (0.08) (0.06)
Diluted earnings per common share, after adoption .................................... $ 1.79 $ 1.66
Net cash provided by operating activities, before adoption .............................. $625,627 $347,809
Adjustment for SFAS 123 ................................................... (15,545) (3,748)
Net cash provided by operating activities, after adoption ............................... $610,082 $344,061
Net cash provided by (used in) financing activities, before adoption ...................... $293,586 $ (75,053)
Adjustment for SFAS 123 ................................................... 15,545 3,748
Net cash provided by (used in) financing activities, after adoption ........................ $309,131 $ (71,305)
12. EARNINGS PER COMMON SHARE COMPUTATION
Detail supporting the computation of basic and diluted earnings per common share was as follows for the
years ended December 31, 2006, 2005 and 2004:
2006 2005 2004
(in thousands, except per share results)
Net income available for common stockholders ..... $487,423 $296,730 $269,947
Weighted average outstanding shares of common
stock used to compute basic earnings per common
share ..................................... 164,137 161,714 160,421
Dilutive effect of:
Employee stock options .................... 3,542 3,751 2,448
Restricted stock awards .................... 317 95 36
Shares used to compute diluted earnings per common
share ..................................... 167,996 165,560 162,905
Basic earnings per common share ................ $ 2.97 $ 1.83 $ 1.68
Diluted earnings per common share ............... $ 2.90 $ 1.79 $ 1.66
86