Humana 2006 Annual Report Download - page 58
Download and view the complete annual report
Please find page 58 of the 2006 Humana annual report below. You can navigate through the pages in the report by either clicking on the pages listed below, or by using the keyword search tool below to find specific information within the annual report.-
 1
1 -
2
-
3
-
4
-
5
-
6
-
7
-
8
-
9
-
10
-
11
-
12
-
13
-
14
-
15
-
16
-
17
-
18
-
19
-
20
-
21
-
22
-
23
-
24
-
25
-
26
-
27
-
28
-
29
-
30
-
31
-
32
-
33
-
34
-
35
-
36
-
37
-
38
-
39
-
40
-
41
-
42
-
43
-
44
-
45
-
46
-
47
-
 48
48 -
 49
49 -
 50
50 -
 51
51 -
 52
52 -
 53
53 -
 54
54 -
 55
55 -
 56
56 -
 57
57 -
 58
58 -
 59
59 -
 60
60 -
 61
61 -
 62
62 -
 63
63 -
 64
64 -
 65
65 -
 66
66 -
 67
67 -
 68
68 -
69
-
70
-
71
-
72
-
73
-
74
-
75
-
76
-
77
-
78
-
79
-
80
-
81
-
82
-
83
-
84
-
85
-
86
-
87
-
88
-
89
-
90
-
91
-
92
-
93
-
94
-
95
-
96
-
97
-
98
-
99
-
100
-
101
-
102
-
103
-
104
-
105
-
106
-
107
-
108
-
109
-
110
-
111
-
112
-
113
-
114
-
115
-
116
-
117
-
118
-
119
-
120
-
121
-
122
-
123
-
124
-
125
-
126
 |
 |

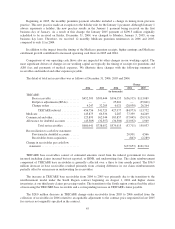
The $77.3 million increase in Medicare receivables in 2006 resulted from the growth in Medicare
membership while the $64.2 million increase in 2005 was due to an increase in receivables associated with
CMS’s risk adjustment model.
The decline in Commercial and other receivables since December 31, 2004 results from the change in the
mix of members from fully insured to ASO.
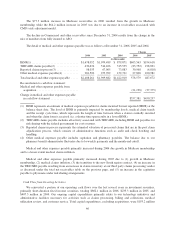
The detail of medical and other expenses payable was as follows at December 31, 2006, 2005 and 2004:
Change
2006 2005 2004 2006 2005
(in thousands)
IBNR(1) ................................ $1,678,052 $1,074,489 $ 879,871 $603,563 $194,618
TRICARE claims payable(2) ............... 430,674 514,426 315,535 (83,752) 198,891
Reported claims in process(3) ............... 98,033 67,065 73,883 30,968 (6,818)
Other medical expenses payable(4) .......... 281,502 253,702 152,721 27,800 100,981
Total medical and other expenses payable ..... $2,488,261 $1,909,682 $1,422,010 578,579 487,672
Reconciliation to cash flow statement:
Medical and other expenses payable from
acquisition ............................ (21,198) (37,375)
Change in medical and other expenses payable
in cash flow statement ................... $557,381 $450,297
(1) IBNR represents an estimate of medical expenses payable for claims incurred but not reported (IBNR) at the
balance sheet date. The level of IBNR is primarily impacted by membership levels, medical claim trends
and the receipt cycle time, which represents the length of time between when a claim is initially incurred
and when the claim form is received (i.e. a shorter time span results in a lower IBNR).
(2) TRICARE claims payable includes all activity associated with TRICARE, including IBNR and payables for
risk sharing with the federal government for cost overruns.
(3) Reported claims in process represents the estimated valuation of processed claims that are in the post claim
adjudication process, which consists of administrative functions such as audit and check batching and
handling.
(4) Other medical expenses payable includes capitation and pharmacy payables. The balance due to our
pharmacy benefit administrator fluctuates due to bi-weekly payments and the month-end cutoff.
Medical and other expenses payable primarily increased during 2006 due growth in Medicare membership
and to a lesser extent medical claims inflation.
Medical and other expenses payable primarily increased during 2005 due to (1) growth in Medicare
membership, (2) medical claims inflation, (3) the transition to the new South region contract, (4) an increase in
the TRICARE payable resulting from an increase in claims inventory at our third party claims processing vendor
as discussed under the total net receivables table on the previous page, and (5) an increase in the capitation
payable to physicians under risk sharing arrangements.
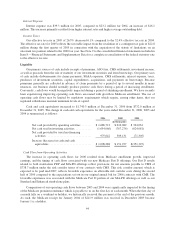
Cash Flow from Investing Activities
We reinvested a portion of our operating cash flows over the last several years in investment securities,
primarily short-duration fixed income securities, totaling $862.1 million in 2006, $233.3 million in 2005, and
$407.3 million in 2004. Our ongoing capital expenditures primarily relate to our technology initiatives and
administrative facilities necessary for activities such as claims processing, billing and collections, medical
utilization review, and customer service. Total capital expenditures, excluding acquisitions, were $193.2 million
46