Humana 2006 Annual Report Download - page 72
Download and view the complete annual report
Please find page 72 of the 2006 Humana annual report below. You can navigate through the pages in the report by either clicking on the pages listed below, or by using the keyword search tool below to find specific information within the annual report.-
 1
1 -
2
-
3
-
4
-
5
-
6
-
7
-
8
-
9
-
10
-
11
-
12
-
13
-
14
-
15
-
16
-
17
-
18
-
19
-
20
-
21
-
22
-
23
-
24
-
25
-
26
-
27
-
28
-
29
-
30
-
31
-
32
-
33
-
34
-
35
-
36
-
37
-
38
-
39
-
40
-
41
-
42
-
43
-
44
-
45
-
46
-
47
-
48
-
49
-
50
-
51
-
52
-
53
-
54
-
55
-
56
-
57
-
58
-
59
-
60
-
61
-
 62
62 -
 63
63 -
 64
64 -
 65
65 -
 66
66 -
 67
67 -
 68
68 -
 69
69 -
 70
70 -
 71
71 -
 72
72 -
 73
73 -
 74
74 -
 75
75 -
 76
76 -
 77
77 -
 78
78 -
 79
79 -
 80
80 -
 81
81 -
 82
82 -
83
-
84
-
85
-
86
-
87
-
88
-
89
-
90
-
91
-
92
-
93
-
94
-
95
-
96
-
97
-
98
-
99
-
100
-
101
-
102
-
103
-
104
-
105
-
106
-
107
-
108
-
109
-
110
-
111
-
112
-
113
-
114
-
115
-
116
-
117
-
118
-
119
-
120
-
121
-
122
-
123
-
124
-
125
-
126
 |
 |

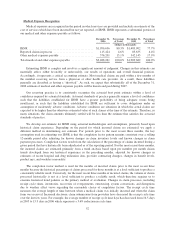
ITEM 7A. QUANTITATIVE AND QUALITATIVE DISCLOSURES ABOUT MARKET RISK
The level of our pretax earnings is subject to market risk due to changes in investment income from our
fixed income portfolio which is partially offset by both our debt position and the short-term duration of the fixed
income investment portfolio.
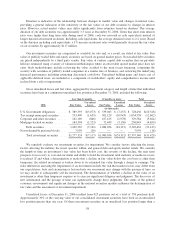
We evaluated the impact on our investment income and debt expense resulting from a hypothetical change
in interest rates of 100, 200 and 300 basis points over the next twelve-month period, as reflected in the following
table. The evaluation was based on our investment portfolio and our debt position as of December 31, 2006 and
2005. Our investment portfolio consists of cash, cash equivalents and investment securities. The modeling
technique used to calculate the pro forma net change in pretax earnings considered the cash flows related to fixed
income investments and debt, which are subject to interest rate changes during a prospective twelve-month
period. This evaluation measures parallel shifts in interest rates and may not account for certain unpredictable
events that may effect interest income, including, among others, unexpected changes of cash flow into and out of
the portfolio, shifts in the asset mix between taxable and tax-exempt securities, and spread changes specific to
various investment categories. In the past ten years, changes in 3 month LIBOR rates during the year have
exceeded 300 basis points once, have not changed between 200 and 300 basis points, have changed between 100
and 200 basis points three times and have changed by less than 100 basis points six times. LIBOR was 5.36% at
December 31, 2006.
Increase (decrease) in
pretax earnings given an
interest rate decrease of
X basis points
Increase (decrease) in
pretax earnings given an
interest rate increase of
X basis points
(300) (200) (100) 100 200 300
(in thousands)
As of December 31, 2006
Investment portfolio .................. $(100,088) $(66,422) $(30,927) $ 30,809 $ 61,808 $ 93,019
Debt ............................... 30,910 20,607 10,303 (10,303) (20,607) (30,910)
Total .......................... $ (69,178) $(45,815) $(20,624) $ 20,506 $ 41,201 $ 62,109
As of December 31, 2005
Investment portfolio .................. $ (54,167) $(35,833) $(17,331) $ 17,375 $ 34,661 $ 52,924
Debt ............................... 33,842 22,561 11,281 (11,281) (22,561) (33,842)
Total .......................... $ (20,325) $(13,272) $ (6,050) $ 6,094 $ 12,100 $ 19,082
60