Humana 2006 Annual Report Download - page 48
Download and view the complete annual report
Please find page 48 of the 2006 Humana annual report below. You can navigate through the pages in the report by either clicking on the pages listed below, or by using the keyword search tool below to find specific information within the annual report.-
 1
1 -
2
-
3
-
4
-
5
-
6
-
7
-
8
-
9
-
10
-
11
-
12
-
13
-
14
-
15
-
16
-
17
-
18
-
19
-
20
-
21
-
22
-
23
-
24
-
25
-
26
-
27
-
28
-
29
-
30
-
31
-
32
-
33
-
34
-
35
-
36
-
37
-
 38
38 -
 39
39 -
 40
40 -
 41
41 -
 42
42 -
 43
43 -
 44
44 -
 45
45 -
 46
46 -
 47
47 -
 48
48 -
 49
49 -
 50
50 -
 51
51 -
 52
52 -
 53
53 -
 54
54 -
 55
55 -
 56
56 -
 57
57 -
 58
58 -
59
-
60
-
61
-
62
-
63
-
64
-
65
-
66
-
67
-
68
-
69
-
70
-
71
-
72
-
73
-
74
-
75
-
76
-
77
-
78
-
79
-
80
-
81
-
82
-
83
-
84
-
85
-
86
-
87
-
88
-
89
-
90
-
91
-
92
-
93
-
94
-
95
-
96
-
97
-
98
-
99
-
100
-
101
-
102
-
103
-
104
-
105
-
106
-
107
-
108
-
109
-
110
-
111
-
112
-
113
-
114
-
115
-
116
-
117
-
118
-
119
-
120
-
121
-
122
-
123
-
124
-
125
-
126
 |
 |

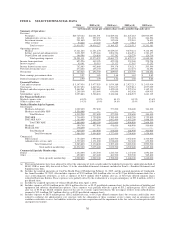
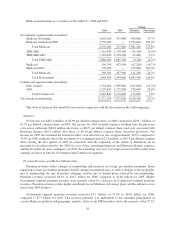
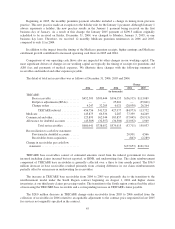
Medical membership was as follows at December 31, 2006 and 2005:
Change
2006 2005 Members Percentage
Government segment medical members:
Medicare Advantage ............................. 1,002,600 557,800 444,800 79.7%
Medicare stand-alone PDP ......................... 3,536,600 — 3,536,600 100.0%
Total Medicare .............................. 4,539,200 557,800 3,981,400 713.8%
TRICARE ...................................... 1,716,400 1,750,900 (34,500) (2.0)%
TRICARE ASO ................................. 1,163,600 1,138,200 25,400 2.2%
Total TRICARE ............................. 2,880,000 2,889,100 (9,100) (0.3)%
Medicaid ....................................... 390,700 457,900 (67,200) (14.7)%
Medicaid ASO .................................. 178,400 — 178,400 100.0%
Total Medicaid .............................. 569,100 457,900 111,200 24.3%
Total Government ........................... 7,988,300 3,904,800 4,083,500 104.6%
Commercial segment medical members:
Fully insured .................................... 1,754,200 1,999,800 (245,600) (12.3)%
ASO .......................................... 1,529,600 1,171,000 358,600 30.6%
Total Commercial ............................ 3,283,800 3,170,800 113,000 3.6%
Total medical membership ............................. 11,272,100 7,075,600 4,196,500 59.3%
This table of financial data should be reviewed in connection with the discussion on the following pages.
Summary
Net income was $487.4 million, or $2.90 per diluted common share, in 2006 compared to $296.7 million, or
$1.79 per diluted common share, in 2005. Net income for 2005 included expenses resulting from the physician
class action settlement ($44.8 million after taxes, or $0.27 per diluted common share) and costs associated with
Hurricane Katrina ($16.9 million after taxes, or $0.10 per diluted common share) described previously. Net
income for 2005 also included the beneficial effect of an effective tax rate of approximately 26.3% compared to
36.0% in 2006, primarily due to the resolution of a contingent gain ($22.8 million, or $0.14 per diluted common
share) during the first quarter of 2005 in connection with the expiration of the statute of limitations on an
uncertain tax position related to the 2000 tax year. After considering litigation and Hurricane Katrina expenses
and the favorable tax gain contingency in 2005, the remaining year over year improvement in 2006 results from
earnings increases in both the Government and Commercial segments.
Premium Revenues and Medical Membership
Premium revenues reflect changes in membership and increases in average per member premiums. Items
impacting average per member premiums include changes in premium rates as well as changes in the geographic
mix of membership, the mix of product offerings, and the mix of benefit plans selected by our membership.
Premium revenues increased 48.0% to $20.7 billion for 2006, compared to $14.0 billion for 2005. Higher
Government segment premium revenues were partially offset by a decrease in Commercial segment premium
revenues. Premium revenues reflect higher enrollment in our Medicare Advantage plans and the addition of our
stand-alone PDP business.
Government segment premium revenues increased $7.1 billion, or 93.6% to $14.6 billion for 2006,
compared to $7.5 billion for 2005. This increase primarily was attributable to the expanded participation in
various Medicare products and geographic markets. Sales of our PFFS products drove the majority of the 79.7%
36