Humana 2006 Annual Report Download - page 95
Download and view the complete annual report
Please find page 95 of the 2006 Humana annual report below. You can navigate through the pages in the report by either clicking on the pages listed below, or by using the keyword search tool below to find specific information within the annual report.-
 1
1 -
2
-
3
-
4
-
5
-
6
-
7
-
8
-
9
-
10
-
11
-
12
-
13
-
14
-
15
-
16
-
17
-
18
-
19
-
20
-
21
-
22
-
23
-
24
-
25
-
26
-
27
-
28
-
29
-
30
-
31
-
32
-
33
-
34
-
35
-
36
-
37
-
38
-
39
-
40
-
41
-
42
-
43
-
44
-
45
-
46
-
47
-
48
-
49
-
50
-
51
-
52
-
53
-
54
-
55
-
56
-
57
-
58
-
59
-
60
-
61
-
62
-
63
-
64
-
65
-
66
-
67
-
68
-
69
-
70
-
71
-
72
-
73
-
74
-
75
-
76
-
77
-
78
-
79
-
80
-
81
-
82
-
83
-
84
-
 85
85 -
 86
86 -
 87
87 -
 88
88 -
 89
89 -
 90
90 -
 91
91 -
 92
92 -
 93
93 -
 94
94 -
 95
95 -
 96
96 -
 97
97 -
 98
98 -
 99
99 -
 100
100 -
 101
101 -
 102
102 -
 103
103 -
 104
104 -
 105
105 -
106
-
107
-
108
-
109
-
110
-
111
-
112
-
113
-
114
-
115
-
116
-
117
-
118
-
119
-
120
-
121
-
122
-
123
-
124
-
125
-
126
 |
 |

Humana Inc.
NOTES TO CONSOLIDATED FINANCIAL STATEMENTS—(Continued)
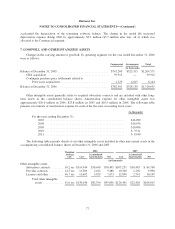
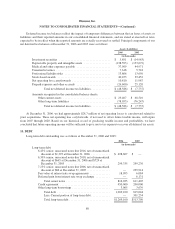
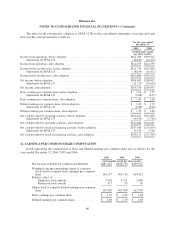
stock-based compensation awards are settled with authorized but unissued company stock. The compensation
expense that has been charged against income for these plans was as follows for the years ended December 31,
2006, 2005, and 2004:
2006 2005 2004
(in thousands)
Stock-based compensation expense by type:
Stock options ...................................... $18,025 $ 24,304 $19,648
Restricted stock awards .............................. 14,533 5,849 844
Total stock-based compensation expense ............ 32,558 30,153 20,492
Tax benefit recognized .......................... (12,028) (11,337) (7,971)
Stock-based compensation expense, net of tax .... $20,530 $ 18,816 $12,521
A greater proportion of the awards granted to employees, excluding executive officers, during 2006 were
restricted stock awards as opposed to stock options when compared to grants made in prior years.
The tax benefit recognized in our consolidated financial statements is based on the amount of compensation
expense recorded for book purposes. The actual tax benefit realized in our tax return is based on the intrinsic
value, or the excess of the market value over the exercise or purchase price, of stock options exercised and
restricted stock awards vested during the period. The actual tax benefit realized for the deductions taken on our
tax returns from option exercises and restricted stock vesting totaled $47.8 million in 2006, $22.3 million in
2005, and $9.0 million in 2004. There was no capitalized stock-based compensation expense.
Beginning April 2006, the stock plans provide that one restricted share is equivalent to 1.7 stock options. At
December 31, 2006, there were 19,559,951 shares reserved for stock award plans, including 12,190,484 shares of
common stock available for future grants assuming all stock options or 7,170,873 shares available for future
grants assuming all restricted shares.
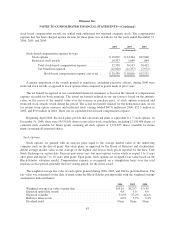
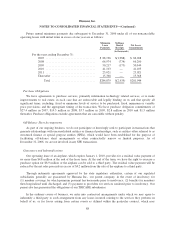
Stock Options
Stock options are granted with an exercise price equal to the average market value of the underlying
common stock on the date of grant. Our stock plans, as approved by the Board of Directors and stockholders,
define average market value as the average of the highest and lowest stock prices reported by the New York
Stock Exchange on a given date. Exercise provisions vary, but most options vest in whole or in part 1 to 3 years
after grant and expire 7 to 10 years after grant. Upon grant, stock options are assigned a fair value based on the
Black-Scholes valuation model. Compensation expense is recognized on a straight-line basis over the total
requisite service period, generally the total vesting period, for the entire award.
The weighted average fair value of each option granted during 2006, 2005, and 2004 is provided below. The
fair value was estimated on the date of grant using the Black-Scholes pricing model with the weighted average
assumptions indicated below:
2006 2005 2004
Weighted average fair value at grant date ........................ $19.10 $12.93 $ 9.95
Expected option life (years) ................................... 4.8 5.0 6.0
Expected volatility .......................................... 31.6% 37.2% 44.6%
Risk-free interest rate ........................................ 4.6% 3.9% 3.4%
Dividend yield ............................................. None None None
83