Humana 2006 Annual Report Download - page 47
Download and view the complete annual report
Please find page 47 of the 2006 Humana annual report below. You can navigate through the pages in the report by either clicking on the pages listed below, or by using the keyword search tool below to find specific information within the annual report.-
 1
1 -
2
-
3
-
4
-
5
-
6
-
7
-
8
-
9
-
10
-
11
-
12
-
13
-
14
-
15
-
16
-
17
-
18
-
19
-
20
-
21
-
22
-
23
-
24
-
25
-
26
-
27
-
28
-
29
-
30
-
31
-
32
-
33
-
34
-
35
-
36
-
 37
37 -
 38
38 -
 39
39 -
 40
40 -
 41
41 -
 42
42 -
 43
43 -
 44
44 -
 45
45 -
 46
46 -
 47
47 -
 48
48 -
 49
49 -
 50
50 -
 51
51 -
 52
52 -
 53
53 -
 54
54 -
 55
55 -
 56
56 -
 57
57 -
58
-
59
-
60
-
61
-
62
-
63
-
64
-
65
-
66
-
67
-
68
-
69
-
70
-
71
-
72
-
73
-
74
-
75
-
76
-
77
-
78
-
79
-
80
-
81
-
82
-
83
-
84
-
85
-
86
-
87
-
88
-
89
-
90
-
91
-
92
-
93
-
94
-
95
-
96
-
97
-
98
-
99
-
100
-
101
-
102
-
103
-
104
-
105
-
106
-
107
-
108
-
109
-
110
-
111
-
112
-
113
-
114
-
115
-
116
-
117
-
118
-
119
-
120
-
121
-
122
-
123
-
124
-
125
-
126
 |
 |

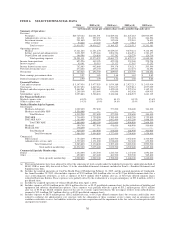
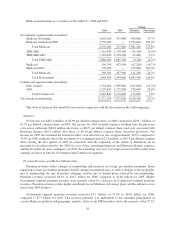
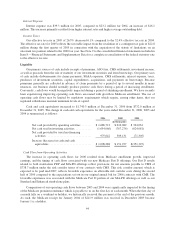
Comparison of Results of Operations for 2006 and 2005
Certain financial data for our two segments was as follows for the years ended December 31, 2006 and
2005:
Change
2006 2005 Dollars Percentage
(dollars in thousands)
Premium revenues:
Medicare Advantage ....................... $ 8,499,064 $ 4,590,362 $3,908,702 85.2%
Medicare stand-alone PDP ................... 3,050,304 — 3,050,304 100.0%
Total Medicare ........................ 11,549,368 4,590,362 6,959,006 151.6%
TRICARE ................................ 2,543,930 2,407,653 136,277 5.7%
Medicaid ................................. 520,520 548,714 (28,194) (5.1)%
Total Government ..................... 14,613,818 7,546,729 7,067,089 93.6%
Fully insured .............................. 5,704,378 6,068,115 (363,737) (6.0)%
Specialty ................................. 410,986 386,747 24,239 6.3%
Total Commercial ...................... 6,115,364 6,454,862 (339,498) (5.3)%
Total ............................ $20,729,182 $14,001,591 $6,727,591 48.0%
Administrative services fees:
Government .............................. $ 49,442 $ 50,059 $ (617) (1.2)%
Commercial .............................. 291,769 209,378 82,391 39.4%
Total ................................ $ 341,211 $ 259,437 $ 81,774 31.5%
Income before income taxes(a):
Government .............................. $ 513,845 $ 316,676 $ 197,169 62.3%
Commercial .............................. 248,240 86,204 162,036 188.0%
Total ................................ $ 762,085 $ 402,880 $ 359,205 89.2%
Medical expense ratios(b):
Government .............................. 85.0% 83.1% 1.9%
Commercial .............................. 81.7% 83.3% (1.6)%
Total ................................ 84.0% 83.2% 0.8%
SG&A expense ratios(a)(c):
Government .............................. 11.8% 12.7% (0.9)%
Commercial .............................. 20.2% 18.5% 1.7%
Total ................................ 14.3% 15.4% (1.1)%
(a) Prior period amounts have been adjusted to reflect the expensing of stock awards under the modified
retrospective application method of SFAS 123R as more fully discussed in Note 11 to the consolidated
financial statements included in Item 8.—Financial Statements and Supplementary Data.
(b) Represents total medical expenses as a percentage of premium revenue. Also known as MER.
(c) Represents total selling, general, and administrative expenses as a percentage of premium revenues and
administrative services fees. Also known as the SG&A expense ratio.
35