Humana 2006 Annual Report Download - page 3
Download and view the complete annual report
Please find page 3 of the 2006 Humana annual report below. You can navigate through the pages in the report by either clicking on the pages listed below, or by using the keyword search tool below to find specific information within the annual report.-
 1
1 -
 2
2 -
 3
3 -
 4
4 -
 5
5 -
 6
6 -
 7
7 -
 8
8 -
 9
9 -
 10
10 -
 11
11 -
 12
12 -
 13
13 -
 14
14 -
15
-
16
-
17
-
18
-
19
-
20
-
21
-
22
-
23
-
24
-
25
-
26
-
27
-
28
-
29
-
30
-
31
-
32
-
33
-
34
-
35
-
36
-
37
-
38
-
39
-
40
-
41
-
42
-
43
-
44
-
45
-
46
-
47
-
48
-
49
-
50
-
51
-
52
-
53
-
54
-
55
-
56
-
57
-
58
-
59
-
60
-
61
-
62
-
63
-
64
-
65
-
66
-
67
-
68
-
69
-
70
-
71
-
72
-
73
-
74
-
75
-
76
-
77
-
78
-
79
-
80
-
81
-
82
-
83
-
84
-
85
-
86
-
87
-
88
-
89
-
90
-
91
-
92
-
93
-
94
-
95
-
96
-
97
-
98
-
99
-
100
-
101
-
102
-
103
-
104
-
105
-
106
-
107
-
108
-
109
-
110
-
111
-
112
-
113
-
114
-
115
-
116
-
117
-
118
-
119
-
120
-
121
-
122
-
123
-
124
-
125
-
126
 |
 |

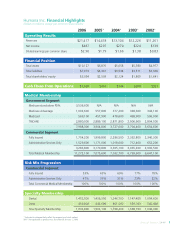
2Annual Report 2006 1
2006 2005*2004*2003*2002*
Operating Results
Revenues
$21,417 $14,418 $13,104 $12,226 $11,261
Net income
$487 $297 $270 $224 $139
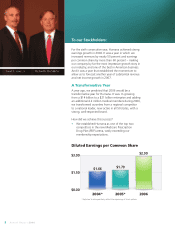
Diluted earnings per common share
$2.90 $1.79 $1.66 $1.38 $0.83
Financial Position
Total assets
$10,127 $6,870 $5,658 $5,380 $4,977
Total liabilities
$7,073 $4,361 $3,534 $3,511 $3,336
Total shareholders’ equity
$3,054 $2,509 $2,124 $1,869 $1,641
Cash Flows From Operations
$1,687 $610 $344 $398 $321
Medical Membership
Government Segment
Medicare stand-alone PDPs
3,536,600 N/A N/A N/A N/A
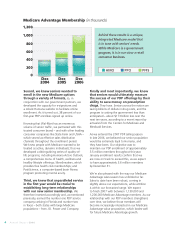
Medicare Advantage
1,002,600 557,800 377,200 328,600 344,100
Medicaid
569,100 457,900 478,600 468,900 506,000
TRICARE
2,880,000 2,889,100 2,871,800 2,906,900 2,804,500
7,988,300 3,904,800 3,727,600 3,704,400 3,654,600
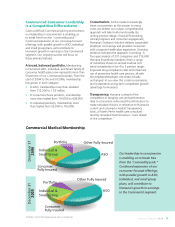
Commercial Segment
Fully Insured
1,754,200 1,999,800 2,286,500 2,352,800 2,340,300
Administrative Services Only
1,529,600 1,171,000 1,018,600 712,400 652,200
3,283,800 3,170,800 3,305,100 3,065,200 2,992,500
Total Medical Membership
11,272,100 7,075,600 7,032,700 6,769,600 6,647,100
Risk Mix Progression
Commercial Segment
Fully Insured
53% 63% 69% 77% 78%
Administrative Services Only
47% 37% 31% 23% 22%
Total Commercial Medical Membership
100% 100% 100% 100% 100%
Specialty Membership
Dental
1,452,000 1,456,500 1,246,700 1,147,400 1,094,600
Other
450,800 445,600 461,500 520,700 545,400
Total Specialty Membership
1,902,800 1,902,100 1,708,200 1,668,100 1,640,000
* Adjusted to retrospectively refl ect the expensing of stock options
N/A – Not applicable as product was fi rst effective January 1, 2006
Humana Inc. Financial Highlights
(dollars in millions, except per common share results)