Humana 2006 Annual Report Download - page 42
Download and view the complete annual report
Please find page 42 of the 2006 Humana annual report below. You can navigate through the pages in the report by either clicking on the pages listed below, or by using the keyword search tool below to find specific information within the annual report.-
 1
1 -
2
-
3
-
4
-
5
-
6
-
7
-
8
-
9
-
10
-
11
-
12
-
13
-
14
-
15
-
16
-
17
-
18
-
19
-
20
-
21
-
22
-
23
-
24
-
25
-
26
-
27
-
28
-
29
-
30
-
31
-
 32
32 -
 33
33 -
 34
34 -
 35
35 -
 36
36 -
 37
37 -
 38
38 -
 39
39 -
 40
40 -
 41
41 -
 42
42 -
 43
43 -
 44
44 -
 45
45 -
 46
46 -
 47
47 -
 48
48 -
 49
49 -
 50
50 -
 51
51 -
 52
52 -
53
-
54
-
55
-
56
-
57
-
58
-
59
-
60
-
61
-
62
-
63
-
64
-
65
-
66
-
67
-
68
-
69
-
70
-
71
-
72
-
73
-
74
-
75
-
76
-
77
-
78
-
79
-
80
-
81
-
82
-
83
-
84
-
85
-
86
-
87
-
88
-
89
-
90
-
91
-
92
-
93
-
94
-
95
-
96
-
97
-
98
-
99
-
100
-
101
-
102
-
103
-
104
-
105
-
106
-
107
-
108
-
109
-
110
-
111
-
112
-
113
-
114
-
115
-
116
-
117
-
118
-
119
-
120
-
121
-
122
-
123
-
124
-
125
-
126
 |
 |

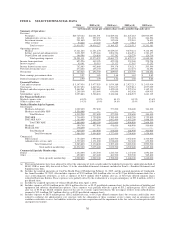
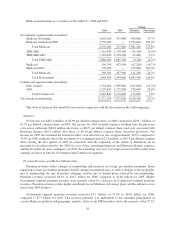
ITEM 6. SELECTED FINANCIAL DATA
2006 2005(a)(b) 2004(a)(c) 2003(a)(d) 2002(a)(e)
(in thousands, except per common share results, membership and ratios)
Summary of Operations:
Revenues:
Premiums .............................. $20,729,182 $14,001,591 $12,689,432 $11,825,283 $10,930,397
Administrative services fees ............... 341,211 259,437 272,796 271,676 244,396
Investment income ...................... 291,880 142,976 132,838 122,041 78,833
Other revenue .......................... 54,264 14,123 9,259 7,311 7,555
Total revenues ...................... 21,416,537 14,418,127 13,104,325 12,226,311 11,261,181
Operating expenses:
Medical ............................... 17,421,204 11,651,470 10,669,647 9,879,421 9,138,196
Selling, general and administrative .......... 3,021,509 2,195,604 1,894,336 1,866,531 1,781,457
Depreciation and amortization ............. 148,598 128,858 117,792 126,779 120,730
Total operating expenses .............. 20,591,311 13,975,932 12,681,775 11,872,731 11,040,383
Income from operations ...................... 825,226 442,195 422,550 353,580 220,798
Interest expense ............................. 63,141 39,315 23,172 17,367 17,252
Income before income taxes ................... 762,085 402,880 399,378 336,213 203,546
Provision for income taxes .................... 274,662 106,150 129,431 112,474 64,694
Net income ................................ $ 487,423 $ 296,730 $ 269,947 $ 223,739 $ 138,852
Basic earnings per common share ............... $ 2.97 $ 1.83 $ 1.68 $ 1.41 $ 0.85
Diluted earnings per common share ............. $ 2.90 $ 1.79 $ 1.66 $ 1.38 $ 0.83
Financial Position:
Cash and investments ........................ $ 5,347,454 $ 3,477,955 $ 3,074,189 $ 2,927,213 $ 2,415,914
Total assets ................................ 10,127,496 6,869,614 5,657,617 5,379,814 4,977,029
Medical and other expenses payable ............. 2,488,261 1,909,682 1,422,010 1,272,156 1,142,131
Debt ...................................... 1,269,100 815,044 636,696 642,638 604,913
Stockholders’ equity ......................... 3,053,886 2,508,874 2,124,248 1,868,972 1,641,115
Key Financial Indicators:
Medical expense ratio ........................ 84.0% 83.2% 84.1% 83.5% 83.6%
SG&A expense ratio ......................... 14.3% 15.4% 14.6% 15.4% 15.9%
Medical Membership by Segment:
Government:
Medicare Advantage ..................... 1,002,600 557,800 377,200 328,600 344,100
Medicare stand-alone PDP ................ 3,536,600 ————
Total Medicare ..................... 4,539,200 557,800 377,200 328,600 344,100
TRICARE ............................. 1,716,400 1,750,900 1,789,400 1,849,700 1,755,800
TRICARE ASO ......................... 1,163,600 1,138,200 1,082,400 1,057,200 1,048,700
Total TRICARE .................... 2,880,000 2,889,100 2,871,800 2,906,900 2,804,500
Medicaid .............................. 390,700 457,900 478,600 468,900 506,000
Medicaid ASO .......................... 178,400 ————
Total Medicaid ..................... 569,100 457,900 478,600 468,900 506,000
Total Government ............... 7,988,300 3,904,800 3,727,600 3,704,400 3,654,600
Commercial:
Fully insured ........................... 1,754,200 1,999,800 2,286,500 2,352,800 2,340,300
Administrative services only ............... 1,529,600 1,171,000 1,018,600 712,400 652,200
Total Commercial ............... 3,283,800 3,170,800 3,305,100 3,065,200 2,992,500
Total medical membership .... 11,272,100 7,075,600 7,032,700 6,769,600 6,647,100
Commercial Specialty Membership:
Dental .................................... 1,452,000 1,456,500 1,246,700 1,147,400 1,094,600
Other ..................................... 450,800 445,600 461,500 520,700 545,400
Total specialty membership . . . 1,902,800 1,902,100 1,708,200 1,668,100 1,640,000
(a) Prior period amounts have been adjusted to reflect the expensing of stock awards under the modified retrospective application method of
SFAS 123R as more fully discussed in Note 11 to the consolidated financial statements included in Item 8.—Financial Statements and
Supplementary Data.
(b) Includes the acquired operations of CarePlus Health Plans of Florida from February 16, 2005, and the acquired operations of Corphealth,
Inc. from December 20, 2005. Also includes expenses of $71.9 million ($44.8 million after tax, or $0.27 per diluted common share) for a
class action litigation settlement, as well as expenses of $27.0 million ($16.9 million after tax, or $0.10 per diluted common share)
related to Hurricane Katrina. These expenses were partially offset by the realization of a tax gain contingency of $22.8 million, or $0.14
per diluted share.
(c) Includes the acquired operations of Ochsner Health Plan from April 1, 2004.
(d) Includes expenses of $30.8 million pretax ($18.8 million after tax, or $0.12 per diluted common share) for the writedown of building and
equipment and software abandonment expenses. These expenses were partially offset by a gain of $15.2 million pretax ($10.1 million
after tax, or $0.06 per diluted common share) for the sale of a venture capital investment. The net impact of these items reduced pretax
income by $15.6 million ($8.7 million after tax, or $0.05 per diluted common share).
(e) Includes expenses of $85.6 million pretax ($58.2 million after tax, or $0.35 per diluted common share) for severance and facility costs
related to reducing our administrative cost structure with the elimination of three customer service centers and an enterprise-wide
workforce reduction, reserves for liabilities related to a previous acquisition and the impairment in the fair value of certain private debt
and equity investments.
30