Humana 2006 Annual Report Download - page 66
Download and view the complete annual report
Please find page 66 of the 2006 Humana annual report below. You can navigate through the pages in the report by either clicking on the pages listed below, or by using the keyword search tool below to find specific information within the annual report.-
 1
1 -
2
-
3
-
4
-
5
-
6
-
7
-
8
-
9
-
10
-
11
-
12
-
13
-
14
-
15
-
16
-
17
-
18
-
19
-
20
-
21
-
22
-
23
-
24
-
25
-
26
-
27
-
28
-
29
-
30
-
31
-
32
-
33
-
34
-
35
-
36
-
37
-
38
-
39
-
40
-
41
-
42
-
43
-
44
-
45
-
46
-
47
-
48
-
49
-
50
-
51
-
52
-
53
-
54
-
55
-
 56
56 -
 57
57 -
 58
58 -
 59
59 -
 60
60 -
 61
61 -
 62
62 -
 63
63 -
 64
64 -
 65
65 -
 66
66 -
 67
67 -
 68
68 -
 69
69 -
 70
70 -
 71
71 -
 72
72 -
 73
73 -
 74
74 -
 75
75 -
 76
76 -
77
-
78
-
79
-
80
-
81
-
82
-
83
-
84
-
85
-
86
-
87
-
88
-
89
-
90
-
91
-
92
-
93
-
94
-
95
-
96
-
97
-
98
-
99
-
100
-
101
-
102
-
103
-
104
-
105
-
106
-
107
-
108
-
109
-
110
-
111
-
112
-
113
-
114
-
115
-
116
-
117
-
118
-
119
-
120
-
121
-
122
-
123
-
124
-
125
-
126
 |
 |

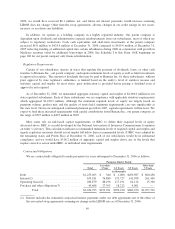
As more fully described on pages 11 and 12, we have a significant percentage of our Medicare and
Medicaid membership under risk-sharing arrangements with providers. Accordingly, the impact of changes in
estimates for prior year medical claims payable on our results of operations that are attributable to our Medicare
and Medicaid lines of business may also be significantly reduced, whether positive or negative.
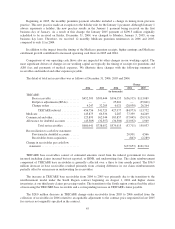
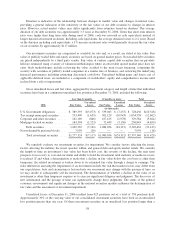
The following table provides a historical perspective regarding the accrual and payment of our medical and
other expense payable. Components of the total incurred claims for each year include amounts accrued for
current year estimated medical expense as well as adjustments to prior year estimated accruals.
2006 2005 2004
(in thousands)
Balances at January 1 ................................... $ 1,909,682 $ 1,422,010 $ 1,272,156
Acquisitions ........................................... 21,198 37,375 71,063
Incurred related to:
Current year ....................................... 17,696,654 11,765,662 10,763,105
Prior years ........................................ (275,450) (114,192) (93,458)
Total incurred ................................. 17,421,204 11,651,470 10,669,647
Paid related to:
Current year ....................................... (15,532,079) (9,979,449) (9,504,331)
Prior years ........................................ (1,331,744) (1,221,724) (1,086,525)
Total paid ..................................... (16,863,823) (11,201,173) (10,590,856)
Balances at December 31 ................................ $ 2,488,261 $ 1,909,682 $ 1,422,010
Amounts incurred related to prior years vary from previously estimated liabilities as the claims ultimately
are settled. Negative amounts reported for incurred related to prior years result from claims being ultimately
settled for amounts less than originally estimated (favorable development).
As summarized in the previous table, claim reserve balances at December 31, 2005 ultimately settled during
2006 for $275.5 million less than the amounts originally estimated. During 2005, claim reserve balances at
December 31, 2004 ultimately settled for $114.2 million less than the amounts originally estimated. This $161.3
million change in the amounts incurred related to prior years for 2006 as compared to 2005 consisted of $106.2
million attributable to our Medicare and commercial lines of business, as well as $55.1 million attributable to our
TRICARE line of business. Amounts attributable to our TRICARE line of business are discussed separately due
to the additional variability and risk sharing provisions with the Department of Defense and subcontractors. As
previously described, our key assumptions consist of trend factors and completion factors using an assumption of
moderately adverse conditions. In our Medicare and commercial operations, both our trend factor and completion
factor assumptions at December 31, 2005 ultimately developed favorable versus our original estimate primarily
due to (1) the utilization of hospital and physician services during the latter half of 2005 ultimately being lower
than estimated, (2) the impact of hurricanes in Florida and Louisiana in the second half of 2005 on both
utilization of services and claims processing, (3) significant growth in our Medicare PFFS product, (4) reductions
in receipt cycle times driven by an increase in electronic claims submissions, and (5) an increase in claim
overpayment recovery levels versus our historical overpayment recovery rate. In our TRICARE line of business,
both our trend factor and completion factor assumptions ultimately developed favorable versus our original
estimate primarily due to the utilization of hospital and physician services during the latter half of 2005
ultimately being lower than estimated, changes in claim payment patterns resulting from fluctuations in claim
inventory levels, and an increase in claim overpayment recovery levels versus our historical overpayment
recovery rate.
During 2004, claim reserve balances at December 31, 2003 ultimately settled during 2004 for $93.5 million
less than the amounts originally estimated. The $20.7 million change in the amounts incurred related to prior
years for 2005 as compared to 2004 consisted of $16.3 million attributable to our TRICARE line of business and
54