Humana 2006 Annual Report Download - page 96
Download and view the complete annual report
Please find page 96 of the 2006 Humana annual report below. You can navigate through the pages in the report by either clicking on the pages listed below, or by using the keyword search tool below to find specific information within the annual report.-
 1
1 -
2
-
3
-
4
-
5
-
6
-
7
-
8
-
9
-
10
-
11
-
12
-
13
-
14
-
15
-
16
-
17
-
18
-
19
-
20
-
21
-
22
-
23
-
24
-
25
-
26
-
27
-
28
-
29
-
30
-
31
-
32
-
33
-
34
-
35
-
36
-
37
-
38
-
39
-
40
-
41
-
42
-
43
-
44
-
45
-
46
-
47
-
48
-
49
-
50
-
51
-
52
-
53
-
54
-
55
-
56
-
57
-
58
-
59
-
60
-
61
-
62
-
63
-
64
-
65
-
66
-
67
-
68
-
69
-
70
-
71
-
72
-
73
-
74
-
75
-
76
-
77
-
78
-
79
-
80
-
81
-
82
-
83
-
84
-
85
-
 86
86 -
 87
87 -
 88
88 -
 89
89 -
 90
90 -
 91
91 -
 92
92 -
 93
93 -
 94
94 -
 95
95 -
 96
96 -
 97
97 -
 98
98 -
 99
99 -
 100
100 -
 101
101 -
 102
102 -
 103
103 -
 104
104 -
 105
105 -
 106
106 -
107
-
108
-
109
-
110
-
111
-
112
-
113
-
114
-
115
-
116
-
117
-
118
-
119
-
120
-
121
-
122
-
123
-
124
-
125
-
126
 |
 |

Humana Inc.
NOTES TO CONSOLIDATED FINANCIAL STATEMENTS—(Continued)
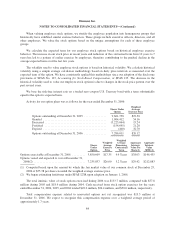
When valuing employee stock options, we stratify the employee population into homogenous groups that
historically have exhibited similar exercise behaviors. These groups include executive officers, directors, and all
other employees. We value the stock options based on the unique assumptions for each of these employee
groups.
We calculate the expected term for our employee stock options based on historical employee exercise
behavior. The increase in our stock price in recent years and reduction of the contractual term from 10 years to 7
years has led to a pattern of earlier exercise by employees, therefore contributing to the gradual decline in the
average expected term over the last few years.
The volatility used to value employee stock options is based on historical volatility. We calculate historical
volatility using a simple average calculation methodology based on daily price intervals as measured over the
expected term of the option. We have consistently applied this methodology since our adoption of the disclosure
provisions of SFAS No. 123, Accounting for Stock-Based Compensation, or SFAS 123. The decrease in the
historical volatility used to value our employee stock options is due to changes in the stock price pattern over the
past several years.
We base the risk-free interest rate on a traded zero-coupon U.S. Treasury bond with a term substantially
equal to the option’s expected term.
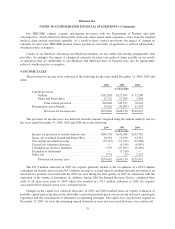
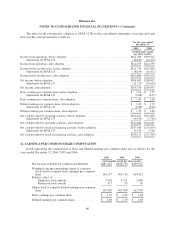
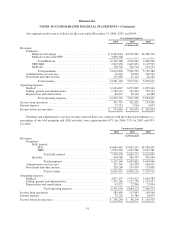
Activity for our option plans was as follows for the year ended December 31, 2006:
Shares Under
Option
Weighted
Average
Exercise Price
Options outstanding at December 31, 2005 ............... 9,661,758 $19.50
Granted ........................................... 1,004,412 54.16
Exercised .......................................... (3,225,064) 15.24
Forfeited .......................................... (154,695) 21.28
Expired ........................................... (400) 32.70
Options outstanding at December 31, 2006 ............... 7,286,011 $26.12
Shares
Under
Option
Weighted
Average
Exercise
Price
Weighted
Average
Remaining
Contractual
Term
Aggregate
Intrinsic
Value Per
Share(1)
Aggregate
Intrinsic
Value
($000)(1)
Options exercisable at December 31, 2006 ......... 3,850,609 $17.35 4.9 Years $38.03 $146,455
Options vested and expected to vest at December 31,
2006(2) ................................... 7,235,837 $26.00 5.2 Years $29.42 $212,883
(1) Computed based upon the amount by which the fair market value of our common stock at December 29,
2006 of $55.38 per share exceeded the weighted average exercise price.
(2) We began estimating forfeitures under SFAS 123R upon adoption on January 1, 2006.
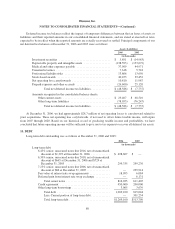
The total intrinsic value of stock options exercised during 2006 was $133.7 million, compared with $57.8
million during 2005 and $18.9 million during 2004. Cash received from stock option exercises for the years
ended December 31, 2006, 2005, and 2004 totaled $49.2 million, $36.4 million, and $30.0 million, respectively.
Total compensation expense related to nonvested options not yet recognized was $19.3 million at
December 31, 2006. We expect to recognize this compensation expense over a weighted average period of
approximately 1.7 years.
84