Humana 2006 Annual Report Download - page 51
Download and view the complete annual report
Please find page 51 of the 2006 Humana annual report below. You can navigate through the pages in the report by either clicking on the pages listed below, or by using the keyword search tool below to find specific information within the annual report.-
 1
1 -
2
-
3
-
4
-
5
-
6
-
7
-
8
-
9
-
10
-
11
-
12
-
13
-
14
-
15
-
16
-
17
-
18
-
19
-
20
-
21
-
22
-
23
-
24
-
25
-
26
-
27
-
28
-
29
-
30
-
31
-
32
-
33
-
34
-
35
-
36
-
37
-
38
-
39
-
40
-
 41
41 -
 42
42 -
 43
43 -
 44
44 -
 45
45 -
 46
46 -
 47
47 -
 48
48 -
 49
49 -
 50
50 -
 51
51 -
 52
52 -
 53
53 -
 54
54 -
 55
55 -
 56
56 -
 57
57 -
 58
58 -
 59
59 -
 60
60 -
 61
61 -
62
-
63
-
64
-
65
-
66
-
67
-
68
-
69
-
70
-
71
-
72
-
73
-
74
-
75
-
76
-
77
-
78
-
79
-
80
-
81
-
82
-
83
-
84
-
85
-
86
-
87
-
88
-
89
-
90
-
91
-
92
-
93
-
94
-
95
-
96
-
97
-
98
-
99
-
100
-
101
-
102
-
103
-
104
-
105
-
106
-
107
-
108
-
109
-
110
-
111
-
112
-
113
-
114
-
115
-
116
-
117
-
118
-
119
-
120
-
121
-
122
-
123
-
124
-
125
-
126
 |
 |
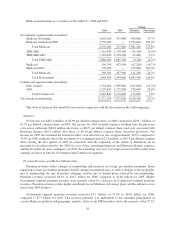
The Commercial segment SG&A expenses increased $59.0 million, or 4.8%, during 2006 compared to
2005. The Commercial segment SG&A expense ratio of 20.2% for 2006 increased 170 basis points from 18.5%
for 2005. Expenses related to the litigation settlement increased the SG&A expense ratio 60 basis points for
2005. After considering the effect of the litigation, the increase primarily resulted from an increase in the
percentage of small group members comprising our total fully insured membership as well as the continued shift
in the mix of membership towards ASO. At December 31, 2005, 37% of our Commercial segment medical
membership related to ASO business compared to 47% at December 31, 2006. Small group accounts bear a
higher SG&A ratio than larger group accounts and ASO business bears a significantly higher SG&A ratio than
fully insured business.
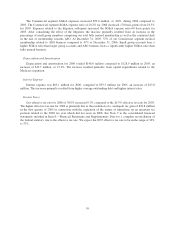
Depreciation and Amortization
Depreciation and amortization for 2006 totaled $148.6 million compared to $128.9 million in 2005, an
increase of $19.7 million, or 15.3%. The increase resulted primarily from capital expenditures related to the
Medicare expansion.
Interest Expense
Interest expense was $63.1 million for 2006, compared to $39.3 million for 2005, an increase of $23.8
million. This increase primarily resulted from higher average outstanding debt and higher interest rates.
Income Taxes
Our effective tax rate for 2006 of 36.0% increased 9.7% compared to the 26.3% effective tax rate for 2005.
The higher effective tax rate for 2006 is primarily due to the resolution of a contingent tax gain of $22.8 million
in the first quarter of 2005 in connection with the expiration of the statute of limitations on an uncertain tax
position related to the 2000 tax year which did not recur in 2006. See Note 9 to the consolidated financial
statements included in Item 8.—Financial Statements and Supplementary Data for a complete reconciliation of
the federal statutory rate to the effective tax rate. We expect the 2007 effective tax rate to be in the range of 36%
to 37%.
39