Humana 2006 Annual Report Download - page 90
Download and view the complete annual report
Please find page 90 of the 2006 Humana annual report below. You can navigate through the pages in the report by either clicking on the pages listed below, or by using the keyword search tool below to find specific information within the annual report.-
 1
1 -
2
-
3
-
4
-
5
-
6
-
7
-
8
-
9
-
10
-
11
-
12
-
13
-
14
-
15
-
16
-
17
-
18
-
19
-
20
-
21
-
22
-
23
-
24
-
25
-
26
-
27
-
28
-
29
-
30
-
31
-
32
-
33
-
34
-
35
-
36
-
37
-
38
-
39
-
40
-
41
-
42
-
43
-
44
-
45
-
46
-
47
-
48
-
49
-
50
-
51
-
52
-
53
-
54
-
55
-
56
-
57
-
58
-
59
-
60
-
61
-
62
-
63
-
64
-
65
-
66
-
67
-
68
-
69
-
70
-
71
-
72
-
73
-
74
-
75
-
76
-
77
-
78
-
79
-
 80
80 -
 81
81 -
 82
82 -
 83
83 -
 84
84 -
 85
85 -
 86
86 -
 87
87 -
 88
88 -
 89
89 -
 90
90 -
 91
91 -
 92
92 -
 93
93 -
 94
94 -
 95
95 -
 96
96 -
 97
97 -
 98
98 -
 99
99 -
 100
100 -
101
-
102
-
103
-
104
-
105
-
106
-
107
-
108
-
109
-
110
-
111
-
112
-
113
-
114
-
115
-
116
-
117
-
118
-
119
-
120
-
121
-
122
-
123
-
124
-
125
-
126
 |
 |

Humana Inc.
NOTES TO CONSOLIDATED FINANCIAL STATEMENTS—(Continued)
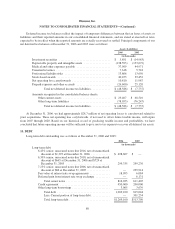
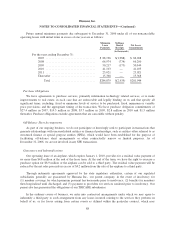
8. MEDICAL AND OTHER EXPENSES PAYABLE
Activity in medical and other expenses payable was as follows for the years ended December 31, 2006,
2005 and 2004:
2006 2005 2004
(in thousands)
Balances at January 1 ................ $ 1,909,682 $ 1,422,010 $ 1,272,156
Acquisitions ........................ 21,198 37,375 71,063
Incurred related to:
Current year .................... 17,696,654 11,765,662 10,763,105
Prior years ..................... (275,450) (114,192) (93,458)
Total incurred .............. 17,421,204 11,651,470 10,669,647
Paid related to:
Current year .................... (15,532,079) (9,979,449) (9,504,331)
Prior years ..................... (1,331,744) (1,221,724) (1,086,525)
Total paid .................. (16,863,823) (11,201,173) (10,590,856)
Balances at December 31 ............. $ 2,488,261 $ 1,909,682 $ 1,422,010
Amounts incurred related to prior years vary from previously estimated liabilities as the claims ultimately
are settled. Negative amounts reported for incurred related to prior years result from claims being ultimately
settled for amounts less than originally estimated (favorable development).
As summarized in the previous table, claim reserve balances at December 31, 2005 ultimately settled during
2006 for $275.5 million less than the amounts originally estimated. During 2005, claim reserve balances at
December 31, 2004 ultimately settled for $114.2 million less than the amounts originally estimated. This $161.3
million change in the amounts incurred related to prior years for 2006 as compared to 2005 consisted of $106.2
million attributable to our Medicare and commercial lines of business, as well as $55.1 million attributable to our
TRICARE line of business. Amounts attributable to our TRICARE line of business are discussed separately due
to the additional variability associated with this business and risk sharing provisions with the Department of
Defense and subcontractors as further described below. The favorable development experienced in our Medicare
and commercial operations primarily was due to (1) the utilization of hospital and physician services during the
latter half of 2005 ultimately being lower than estimated, (2) the impact of hurricanes in Florida and Louisiana in
the second half of 2005 on both utilization of services and claims processing, (3) significant growth in our
Medicare PFFS product, (4) reductions in receipt cycle times driven by an increase in electronic claims
submissions, and (5) an increase in claim overpayment recovery levels versus our historical overpayment
recovery rate. The favorable development experienced in our TRICARE line of business primarily was due to the
utilization of hospital and physician services during the latter half of 2005 ultimately being lower than estimated,
changes in claim payment patterns resulting from fluctuations in claim inventory levels, and an increase in claim
overpayment recovery levels versus our historical overpayment recovery rate.
During 2004, claim reserve balances at December 31, 2003 ultimately settled during 2004 for $93.5 million
less than the amounts originally estimated. The $20.7 million change in the amounts incurred related to prior
years for 2005 as compared to 2004 consisted of $16.3 million attributable to our TRICARE line of business and
$4.4 million attributable to our Medicare and commercial lines of business. In each of these lines of business, the
favorable development primarily was due to the utilization of hospital and physician services during the latter
half of 2004 ultimately being lower than originally estimated.
78