Humana 2009 Annual Report Download - page 106
Download and view the complete annual report
Please find page 106 of the 2009 Humana annual report below. You can navigate through the pages in the report by either clicking on the pages listed below, or by using the keyword search tool below to find specific information within the annual report.-
 1
1 -
2
-
3
-
4
-
5
-
6
-
7
-
8
-
9
-
10
-
11
-
12
-
13
-
14
-
15
-
16
-
17
-
18
-
19
-
20
-
21
-
22
-
23
-
24
-
25
-
26
-
27
-
28
-
29
-
30
-
31
-
32
-
33
-
34
-
35
-
36
-
37
-
38
-
39
-
40
-
41
-
42
-
43
-
44
-
45
-
46
-
47
-
48
-
49
-
50
-
51
-
52
-
53
-
54
-
55
-
56
-
57
-
58
-
59
-
60
-
61
-
62
-
63
-
64
-
65
-
66
-
67
-
68
-
69
-
70
-
71
-
72
-
73
-
74
-
75
-
76
-
77
-
78
-
79
-
80
-
81
-
82
-
83
-
84
-
85
-
86
-
87
-
88
-
89
-
90
-
91
-
92
-
93
-
94
-
95
-
 96
96 -
 97
97 -
 98
98 -
 99
99 -
 100
100 -
 101
101 -
 102
102 -
 103
103 -
 104
104 -
 105
105 -
 106
106 -
 107
107 -
 108
108 -
 109
109 -
 110
110 -
 111
111 -
 112
112 -
 113
113 -
 114
114 -
 115
115 -
 116
116 -
117
-
118
-
119
-
120
-
121
-
122
-
123
-
124
-
125
-
126
-
127
-
128
-
129
-
130
-
131
-
132
-
133
-
134
-
135
-
136
-
137
-
138
-
139
-
140
 |
 |

Humana Inc.
NOTES TO CONSOLIDATED FINANCIAL STATEMENTS—(Continued)
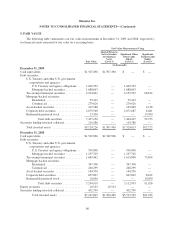
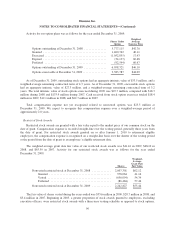
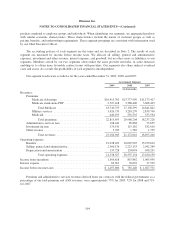
Activity for our option plans was as follows for the year ended December 31, 2009:
Shares Under
Option
Weighted-
Average
Exercise Price
Options outstanding at December 31, 2008 ............... 5,777,115 $42.70
Granted ........................................... 1,460,742 40.11
Exercised .......................................... (1,052,855) 17.43
Expired ........................................... (34,137) 60.48
Forfeited .......................................... (92,544) 60.67
Options outstanding at December 31, 2009 ............... 6,058,321 $46.10
Options exercisable at December 31, 2009 ................ 3,383,787 $44.09
As of December 31, 2009, outstanding stock options had an aggregate intrinsic value of $33.5 million, and a
weighted-average remaining contractual term of 4.3 years. As of December 31, 2009, exercisable stock options
had an aggregate intrinsic value of $27.3 million, and a weighted-average remaining contractual term of 3.2
years. The total intrinsic value of stock options exercised during 2009 was $23.7 million, compared with $18.3
million during 2008 and $133.9 million during 2007. Cash received from stock option exercises totaled $18.4
million in 2009, $12.1 million in 2008, and $62.7 million in 2007.
Total compensation expense not yet recognized related to nonvested options was $25.5 million at
December 31, 2009. We expect to recognize this compensation expense over a weighted-average period of
approximately 2.0 years.
Restricted Stock Awards
Restricted stock awards are granted with a fair value equal to the market price of our common stock on the
date of grant. Compensation expense is recorded straight-line over the vesting period, generally three years from
the date of grant. For restricted stock awards granted on or after January 1, 2010 to retirement eligible
employees, the compensation expense is recognized on a straight-line basis over the shorter of the vesting period
or the period from the date of grant to an employee’s eligible retirement date.
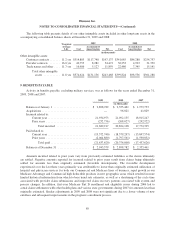
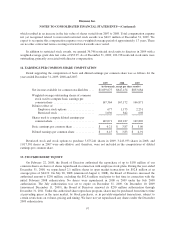
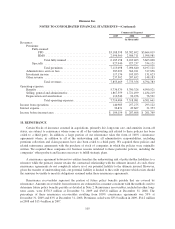
The weighted-average grant date fair value of our restricted stock awards was $41.16 in 2009, $68.10 in
2008, and $63.59 in 2007. Activity for our restricted stock awards was as follows for the year ended
December 31, 2009:
Shares
Weighted-
Average
Grant-Date
Fair Value
Nonvested restricted stock at December 31, 2008 ............. 2,007,301 $62.12
Granted .......................................... 978,064 41.16
Vested ........................................... (656,054) 54.34
Forfeited ......................................... (86,484) 57.46
Nonvested restricted stock at December 31, 2009 ............. 2,242,827 $55.44
The fair value of shares vested during the years ended was $35.6 million in 2009, $28.7 million in 2008, and
$3.4 million in 2007. Beginning in 2005, a greater proportion of stock awards granted to employees, excluding
executive officers, were restricted stock awards with a three-year vesting schedule as opposed to stock options,
96