Humana 2009 Annual Report Download - page 14
Download and view the complete annual report
Please find page 14 of the 2009 Humana annual report below. You can navigate through the pages in the report by either clicking on the pages listed below, or by using the keyword search tool below to find specific information within the annual report.-
 1
1 -
2
-
3
-
 4
4 -
 5
5 -
 6
6 -
 7
7 -
 8
8 -
 9
9 -
 10
10 -
 11
11 -
 12
12 -
 13
13 -
 14
14 -
 15
15 -
 16
16 -
 17
17 -
 18
18 -
 19
19 -
 20
20 -
 21
21 -
 22
22 -
 23
23 -
 24
24 -
25
-
26
-
27
-
28
-
29
-
30
-
31
-
32
-
33
-
34
-
35
-
36
-
37
-
38
-
39
-
40
-
41
-
42
-
43
-
44
-
45
-
46
-
47
-
48
-
49
-
50
-
51
-
52
-
53
-
54
-
55
-
56
-
57
-
58
-
59
-
60
-
61
-
62
-
63
-
64
-
65
-
66
-
67
-
68
-
69
-
70
-
71
-
72
-
73
-
74
-
75
-
76
-
77
-
78
-
79
-
80
-
81
-
82
-
83
-
84
-
85
-
86
-
87
-
88
-
89
-
90
-
91
-
92
-
93
-
94
-
95
-
96
-
97
-
98
-
99
-
100
-
101
-
102
-
103
-
104
-
105
-
106
-
107
-
108
-
109
-
110
-
111
-
112
-
113
-
114
-
115
-
116
-
117
-
118
-
119
-
120
-
121
-
122
-
123
-
124
-
125
-
126
-
127
-
128
-
129
-
130
-
131
-
132
-
133
-
134
-
135
-
136
-
137
-
138
-
139
-
140
 |
 |

with similar economic characteristics. These characteristics include the nature of customer groups as well as
pricing, benefits, and underwriting requirements. These segment groupings are consistent with information used
by our Chief Executive Officer.
The results of each segment are measured by income before income taxes. We allocate all selling, general
and administrative expenses, investment and other revenue, interest expense, and goodwill, but no other assets or
liabilities, to our segments. Members served by our two segments often utilize the same provider networks, in
some instances enabling us to obtain more favorable contract terms with providers. Our segments also share
indirect overhead costs and assets. As a result, the profitability of each segment is interdependent.
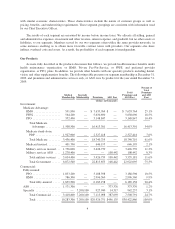
Our Products
As more fully described in the products discussion that follows, we provide health insurance benefits under
health maintenance organization, or HMO, Private Fee-For-Service, or PFFS, and preferred provider
organization, or PPO, plans. In addition, we provide other benefits with our specialty products including dental,
vision, and other supplementary benefits. The following table presents our segment membership at December 31,
2009, and premiums and administrative services only, or ASO, fees by product for the year ended December 31,
2009:
Medical
Membership
Specialty
Membership Premiums ASO Fees
Total
Premiums and
ASO Fees
Percent of
Total
Premiums
and ASO
Fees
(dollars in thousands)
Government:
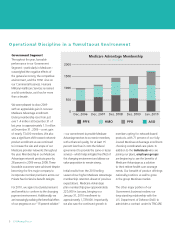
Medicare Advantage:
HMO .................. 591,900 — $ 7,633,764 $ — $ 7,633,764 25.1%
PFFS .................. 564,200 — 5,630,690 — 5,630,690 18.5%
PPO ................... 352,400 — 3,148,847 — 3,148,847 10.4%
Total Medicare
Advantage .......... 1,508,500 — 16,413,301 — 16,413,301 54.0%
Medicare stand-alone
PDP ................. 1,927,900 — 2,327,418 — 2,327,418 7.6%
Total Medicare ........ 3,436,400 — 18,740,719 — 18,740,719 61.6%
Medicaid insured ......... 401,700 — 646,195 — 646,195 2.1%
Military services insured . . . 1,756,000 — 3,426,739 — 3,426,739 11.3%
Military services ASO .... 1,278,400 — — 108,442 108,442 0.3%
Total military services . . 3,034,400 — 3,426,739 108,442 3,535,181 11.6%
Total Government ...... 6,872,500 — 22,813,653 108,442 22,922,095 75.3%
Commercial:
Fully-insured:
PPO ................... 1,053,200 — 3,188,598 — 3,188,598 10.5%
HMO .................. 786,300 — 2,996,560 — 2,996,560 9.9%
Total fully-insured ..... 1,839,500 — 6,185,158 — 6,185,158 20.4%
ASO..................... 1,571,300 — — 373,376 373,376 1.2%
Specialty ................. — 7,200,100 927,940 14,317 942,257 3.1%
Total Commercial ...... 3,410,800 7,200,100 7,113,098 387,693 7,500,791 24.7%
Total ................ 10,283,300 7,200,100 $29,926,751 $496,135 $30,422,886 100.0%
4