Humana 2009 Annual Report Download - page 67
Download and view the complete annual report
Please find page 67 of the 2009 Humana annual report below. You can navigate through the pages in the report by either clicking on the pages listed below, or by using the keyword search tool below to find specific information within the annual report.-
 1
1 -
2
-
3
-
4
-
5
-
6
-
7
-
8
-
9
-
10
-
11
-
12
-
13
-
14
-
15
-
16
-
17
-
18
-
19
-
20
-
21
-
22
-
23
-
24
-
25
-
26
-
27
-
28
-
29
-
30
-
31
-
32
-
33
-
34
-
35
-
36
-
37
-
38
-
39
-
40
-
41
-
42
-
43
-
44
-
45
-
46
-
47
-
48
-
49
-
50
-
51
-
52
-
53
-
54
-
55
-
56
-
 57
57 -
 58
58 -
 59
59 -
 60
60 -
 61
61 -
 62
62 -
 63
63 -
 64
64 -
 65
65 -
 66
66 -
 67
67 -
 68
68 -
 69
69 -
 70
70 -
 71
71 -
 72
72 -
 73
73 -
 74
74 -
 75
75 -
 76
76 -
 77
77 -
78
-
79
-
80
-
81
-
82
-
83
-
84
-
85
-
86
-
87
-
88
-
89
-
90
-
91
-
92
-
93
-
94
-
95
-
96
-
97
-
98
-
99
-
100
-
101
-
102
-
103
-
104
-
105
-
106
-
107
-
108
-
109
-
110
-
111
-
112
-
113
-
114
-
115
-
116
-
117
-
118
-
119
-
120
-
121
-
122
-
123
-
124
-
125
-
126
-
127
-
128
-
129
-
130
-
131
-
132
-
133
-
134
-
135
-
136
-
137
-
138
-
139
-
140
 |
 |

expense components. Other external factors such as government-mandated benefits or other regulatory changes,
increases in medical services capacity, direct to consumer advertising for prescription drugs and medical
services, an aging population, catastrophes, and epidemics also may impact medical cost trends. Internal factors
such as system conversions, claims processing cycle times, changes in medical management practices and
changes in provider contracts also may impact our ability to accurately predict estimates of historical completion
factors or medical cost trends. All of these factors are considered in estimating IBNR and in estimating the per
member per month claims trend for purposes of determining the reserve for the most recent three months.
Additionally, we continually prepare and review follow-up studies to assess the reasonableness of the estimates
generated by our process and methods over time. The results of these studies are also considered in determining
the reserve for the most recent three months. Each of these factors requires significant judgment by management.
The completion and claims per member per month trend factors are the most significant factors impacting the
IBNR estimate. The portion of IBNR estimated using completion factors for claims incurred prior to the most recent
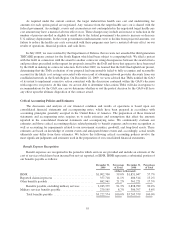
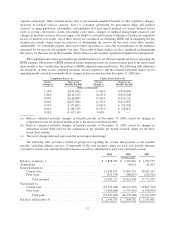
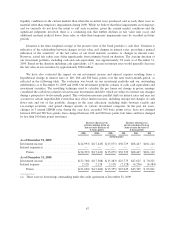
three months is less variable than the portion of IBNR estimated using trend factors. The following table illustrates
the sensitivity of these factors assuming moderate adverse experience and the estimated potential impact on our
operating results caused by reasonably likely changes in these factors based on December 31, 2009 data:
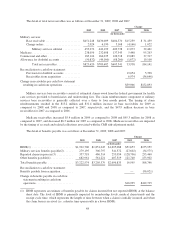
Completion Factor (a): Claims Trend Factor (b):
Factor
Change (c)
Decrease in
Benefits Payable
Factor
Change (c)
Decrease in
Benefits Payable
(dollars in thousands)
1.10% $(147,656) (5.50)% $(250,189)
1.00% $(134,232) (4.25)% $(193,328)
0.90% $(120,809) (3.50)% $(159,211)
0.80% $(107,386) (2.75)% $(125,095)
0.70% $ (93,963) (2.00)% $ (90,978)
0.60% $ (80,539) (1.25)% $ (58,861)
0.50% $ (67,116) 0.00% $ —
(a) Reflects estimated potential changes in benefits payable at December 31, 2009 caused by changes in
completion factors for incurred months prior to the most recent three months.
(b) Reflects estimated potential changes in benefits payable at December 31, 2009 caused by changes in
annualized claims trend used for the estimation of per member per month incurred claims for the most
recent three months.
(c) The factor change indicated represents the percentage point change.
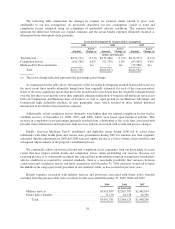
The following table provides a historical perspective regarding the accrual and payment of our benefits
payable, excluding military services. Components of the total incurred claims for each year include amounts
accrued for current year estimated benefit expenses as well as adjustments to prior year estimated accruals.
2009 2008 2007
(in thousands)
Balances at January 1 ................................... $ 2,898,782 $ 2,355,461 $ 1,979,733
Acquisitions ........................................... — 96,021 41,029
Incurred related to:
Current year ....................................... 21,934,973 21,092,135 18,015,247
Prior years ........................................ (252,756) (268,027) (242,922)
Total incurred ................................. 21,682,217 20,824,108 17,772,325
Paid related to:
Current year ....................................... (19,572,740) (18,579,247) (15,847,574)
Prior years ........................................ (2,064,880) (1,797,561) (1,590,052)
Total paid ..................................... (21,637,620) (20,376,808) (17,437,626)
Balances at December 31 ................................ $ 2,943,379 $ 2,898,782 $ 2,355,461
57