Humana 2009 Annual Report Download - page 118
Download and view the complete annual report
Please find page 118 of the 2009 Humana annual report below. You can navigate through the pages in the report by either clicking on the pages listed below, or by using the keyword search tool below to find specific information within the annual report.-
 1
1 -
2
-
3
-
4
-
5
-
6
-
7
-
8
-
9
-
10
-
11
-
12
-
13
-
14
-
15
-
16
-
17
-
18
-
19
-
20
-
21
-
22
-
23
-
24
-
25
-
26
-
27
-
28
-
29
-
30
-
31
-
32
-
33
-
34
-
35
-
36
-
37
-
38
-
39
-
40
-
41
-
42
-
43
-
44
-
45
-
46
-
47
-
48
-
49
-
50
-
51
-
52
-
53
-
54
-
55
-
56
-
57
-
58
-
59
-
60
-
61
-
62
-
63
-
64
-
65
-
66
-
67
-
68
-
69
-
70
-
71
-
72
-
73
-
74
-
75
-
76
-
77
-
78
-
79
-
80
-
81
-
82
-
83
-
84
-
85
-
86
-
87
-
88
-
89
-
90
-
91
-
92
-
93
-
94
-
95
-
96
-
97
-
98
-
99
-
100
-
101
-
102
-
103
-
104
-
105
-
106
-
107
-
 108
108 -
 109
109 -
 110
110 -
 111
111 -
 112
112 -
 113
113 -
 114
114 -
 115
115 -
 116
116 -
 117
117 -
 118
118 -
 119
119 -
 120
120 -
 121
121 -
 122
122 -
 123
123 -
 124
124 -
 125
125 -
 126
126 -
 127
127 -
 128
128 -
129
-
130
-
131
-
132
-
133
-
134
-
135
-
136
-
137
-
138
-
139
-
140
 |
 |

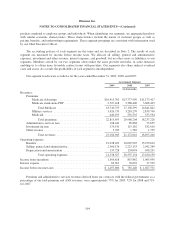
Humana Inc.
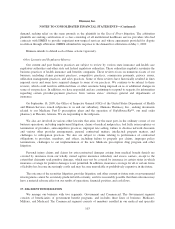
QUARTERLY FINANCIAL INFORMATION
(Unaudited)
A summary of our quarterly unaudited results of operations for the years ended December 31, 2009 and
2008 follows:
2009
First Second Third Fourth
(in thousands, except per share results)
Total revenues ................................. $7,711,661 $7,898,889 $7,716,819 $7,633,045
Income before income taxes ...................... 293,762 439,950 469,348 398,700
Net income ................................... 205,717 281,780 301,519 250,659
Basic earnings per common share .................. 1.23 1.68 1.80 1.49
Diluted earnings per common share ................ 1.22 1.67 1.78 1.48
2008
First Second Third Fourth
(in thousands, except per share results)
Total revenues ................................. $6,959,704 $7,350,862 $7,148,170 $7,487,636
Income before income taxes ...................... 123,928 325,014 282,860 261,046
Net income ................................... 80,170 209,896 183,008 174,080
Basic earnings per common share .................. 0.48 1.26 1.10 1.04
Diluted earnings per common share ................ 0.47 1.24 1.09 1.03
108