Humana 2009 Annual Report Download - page 66
Download and view the complete annual report
Please find page 66 of the 2009 Humana annual report below. You can navigate through the pages in the report by either clicking on the pages listed below, or by using the keyword search tool below to find specific information within the annual report.-
 1
1 -
2
-
3
-
4
-
5
-
6
-
7
-
8
-
9
-
10
-
11
-
12
-
13
-
14
-
15
-
16
-
17
-
18
-
19
-
20
-
21
-
22
-
23
-
24
-
25
-
26
-
27
-
28
-
29
-
30
-
31
-
32
-
33
-
34
-
35
-
36
-
37
-
38
-
39
-
40
-
41
-
42
-
43
-
44
-
45
-
46
-
47
-
48
-
49
-
50
-
51
-
52
-
53
-
54
-
55
-
 56
56 -
 57
57 -
 58
58 -
 59
59 -
 60
60 -
 61
61 -
 62
62 -
 63
63 -
 64
64 -
 65
65 -
 66
66 -
 67
67 -
 68
68 -
 69
69 -
 70
70 -
 71
71 -
 72
72 -
 73
73 -
 74
74 -
 75
75 -
 76
76 -
77
-
78
-
79
-
80
-
81
-
82
-
83
-
84
-
85
-
86
-
87
-
88
-
89
-
90
-
91
-
92
-
93
-
94
-
95
-
96
-
97
-
98
-
99
-
100
-
101
-
102
-
103
-
104
-
105
-
106
-
107
-
108
-
109
-
110
-
111
-
112
-
113
-
114
-
115
-
116
-
117
-
118
-
119
-
120
-
121
-
122
-
123
-
124
-
125
-
126
-
127
-
128
-
129
-
130
-
131
-
132
-
133
-
134
-
135
-
136
-
137
-
138
-
139
-
140
 |
 |
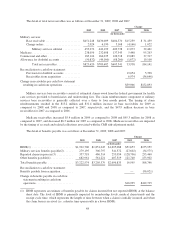
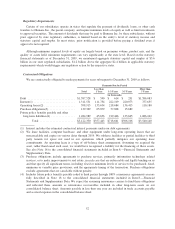
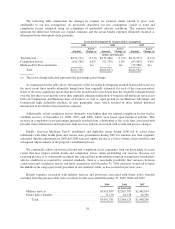
Military services benefits payable primarily consists of our estimate of incurred healthcare services provided
to beneficiaries which are in turn reimbursed by the federal government as more fully described in Note 2 to the
consolidated financial statements included in Item 8.—Financial Statements and Supplementary Data. This
amount is generally offset by a corresponding receivable due from the federal government, as more fully-
described on page 48.
Estimating IBNR is complex and involves a significant amount of judgment. Changes in this estimate can
materially affect, either favorably or unfavorably, our results of operations and overall financial position.
Accordingly, it represents a critical accounting estimate. Most benefit claims are paid within a few months of the
member receiving service from a physician or other health care provider. As a result, these liabilities generally
are described as having a “short-tail”. As such, we expect that substantially all of the December 31, 2009
estimate of benefits payable will be known and paid during 2010.
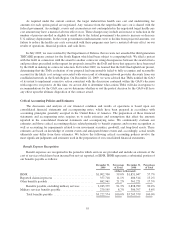
Our reserving practice is to consistently recognize the actuarial best point estimate within a level of
confidence required by actuarial standards. Actuarial standards of practice generally require a level of confidence
such that the liabilities established for IBNR have a greater probability of being adequate versus being
insufficient, or such that the liabilities established for IBNR are sufficient to cover obligations under an
assumption of moderately adverse conditions. Adverse conditions are situations in which the actual claims are
expected to be higher than the otherwise estimated value of such claims at the time of the estimate. Therefore, in
many situations, the claim amounts ultimately settled will be less than the estimate that satisfies the actuarial
standards of practice.
We develop our estimate for IBNR using actuarial methodologies and assumptions, primarily based upon
historical claim experience. Depending on the period for which incurred claims are estimated, we apply a different
method in determining our estimate. For periods prior to the most recent three months, the key assumption used in
estimating our IBNR is that the completion factor pattern remains consistent over a rolling 12-month period after
adjusting for known changes in claim inventory levels and known changes in claim payment processes. Completion
factors result from the calculation of the percentage of claims incurred during a given period that have historically
been adjudicated as of the reporting period. For the most recent three months, the incurred claims are estimated
primarily from a trend analysis based upon per member per month claims trends developed from our historical
experience in the preceding months, adjusted for known changes in estimates of recent hospital and drug utilization
data, provider contracting changes, changes in benefit levels, changes in member cost sharing, changes in medical
management processes, product mix, and weekday seasonality.
The completion factor method is used for the months of incurred claims prior to the most recent three
months because the historical percentage of claims processed for those months is at a level sufficient to produce a
consistently reliable result. Conversely, for the most recent three months of incurred claims, the volume of claims
processed historically is not at a level sufficient to produce a reliable result, which therefore requires us to
examine historical trend patterns as the primary method of evaluation. Changes in claim processes, including
receipt cycle times, claim inventory levels, recoveries of overpayments, outsourcing, system conversions, and
processing disruptions due to weather or other events affect views regarding the reasonable choice of completion
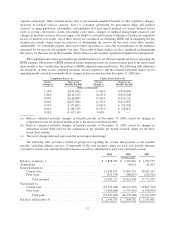
factors. The receipt cycle time measures the average length of time between when a medical claim was initially
incurred and when the claim form was received. Increased electronic claim submissions from providers have
decreased the receipt cycle time over the last few years. For example, the average receipt cycle time has
decreased from 15.6 days in 2007 to 14.0 days in 2009 which represents a 10.3% reduction in cycle time over the
three year period. If claims are submitted or processed on a faster (slower) pace than prior periods, the actual
claim may be more (less) complete than originally estimated using our completion factors, which may result in
reserves that are higher (lower) than required.
Medical cost trends potentially are more volatile than other segments of the economy. The drivers of
medical cost trends include increases in the utilization of hospital facilities, physician services, prescription
drugs, and new medical technologies, as well as the inflationary effect on the cost per unit of each of these
56