Humana 2009 Annual Report Download - page 44
Download and view the complete annual report
Please find page 44 of the 2009 Humana annual report below. You can navigate through the pages in the report by either clicking on the pages listed below, or by using the keyword search tool below to find specific information within the annual report.-
 1
1 -
2
-
3
-
4
-
5
-
6
-
7
-
8
-
9
-
10
-
11
-
12
-
13
-
14
-
15
-
16
-
17
-
18
-
19
-
20
-
21
-
22
-
23
-
24
-
25
-
26
-
27
-
28
-
29
-
30
-
31
-
32
-
33
-
 34
34 -
 35
35 -
 36
36 -
 37
37 -
 38
38 -
 39
39 -
 40
40 -
 41
41 -
 42
42 -
 43
43 -
 44
44 -
 45
45 -
 46
46 -
 47
47 -
 48
48 -
 49
49 -
 50
50 -
 51
51 -
 52
52 -
 53
53 -
 54
54 -
55
-
56
-
57
-
58
-
59
-
60
-
61
-
62
-
63
-
64
-
65
-
66
-
67
-
68
-
69
-
70
-
71
-
72
-
73
-
74
-
75
-
76
-
77
-
78
-
79
-
80
-
81
-
82
-
83
-
84
-
85
-
86
-
87
-
88
-
89
-
90
-
91
-
92
-
93
-
94
-
95
-
96
-
97
-
98
-
99
-
100
-
101
-
102
-
103
-
104
-
105
-
106
-
107
-
108
-
109
-
110
-
111
-
112
-
113
-
114
-
115
-
116
-
117
-
118
-
119
-
120
-
121
-
122
-
123
-
124
-
125
-
126
-
127
-
128
-
129
-
130
-
131
-
132
-
133
-
134
-
135
-
136
-
137
-
138
-
139
-
140
 |
 |
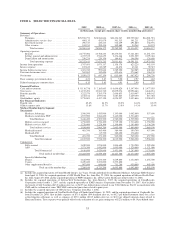
ITEM 7. MANAGEMENT’S DISCUSSION AND ANALYSIS OF FINANCIAL CONDITION AND
RESULTS OF OPERATIONS
Overview
Headquartered in Louisville, Kentucky, Humana is one of the nation’s largest publicly traded health and
supplemental benefits companies, based on our 2009 revenues of approximately $31.0 billion. We are a full-
service benefits solutions company, offering a wide array of health and supplemental benefit products for
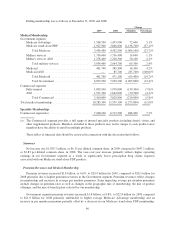
employer groups, government benefit programs, and individuals. As of December 31, 2009, we had
approximately 10.3 million members in our medical benefit plans, as well as approximately 7.2 million members
in our specialty products.
We manage our business with two segments: Government and Commercial. The Government segment
consists of beneficiaries of government benefit programs, and includes three lines of business: Medicare,
Military, and Medicaid. The Commercial segment consists of members enrolled in our medical and specialty
products marketed to employer groups and individuals. When identifying our segments, we aggregated products
with similar economic characteristics. These characteristics include the nature of customer groups as well as
pricing, benefits, and underwriting requirements. These segment groupings are consistent with information used
by our Chief Executive Officer.
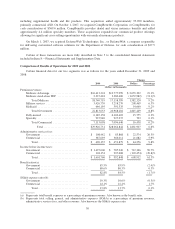
The results of each segment are measured by income before income taxes. We allocate all selling, general
and administrative expenses, investment and other revenue, interest expense, and goodwill, but no other assets or
liabilities, to our segments. Members served by our two segments often utilize the same provider networks, in
some instances enabling us to obtain more favorable contract terms with providers. Our segments also share
indirect overhead costs and assets. As a result, the profitability of each segment is interdependent.
Our results are impacted by many factors, but most notably are influenced by our ability to establish and
maintain a competitive and efficient cost structure and to accurately and consistently establish competitive
premium, ASO fee, and plan benefit levels that are commensurate with our benefit and administrative costs.
Benefit costs are subject to a high rate of inflation due to many forces, including new higher priced technologies
and medical procedures, new prescription drugs and therapies, an aging population, lifestyle challenges including
diet and smoking, the tort liability system, and government regulation.
Our industry relies on two key statistics to measure performance. The benefit ratio, which is computed by
taking total benefit expenses as a percentage of premium revenues, represents a statistic used to measure
underwriting profitability. The selling, general, and administrative expense ratio, or SG&A expense ratio, which
is computed by taking total selling, general and administrative expenses as a percentage of premium revenues,
administrative services fees and other revenues, represents a statistic used to measure administrative spending
efficiency.
Proposed Health Insurance Initiatives
The President of the United States and members of the U.S. Congress have proposed significant reforms to
the U.S. health care system. In November 2009, the U.S. House of Representatives passed the Affordable Health
Care for America Act and in December 2009 the U.S. Senate passed The Patient Protection and Affordable Care
Act, which we refer to collectively as the “Acts”. While there are significant differences between the two Acts,
they include, for example, limiting Medicare Advantage payment rates, mandatory issuance of insurance
coverage, requirements that would limit the ability of health plans and insurers to vary premiums based on
assessments of underlying risk, stipulating annual rebates to enrollees if the amount of premium revenues
expended on medical costs falls below prescribed ratios for group and individual health insurance coverage, and
imposing new non-deductible taxes on health insurers increasing in the aggregate from $2 billion to $10 billion
annually over ten years. In addition, certain members of Congress have proposed a single-payer health care
system, a government health insurance option to compete with private plans, and other expanded public health
care measures. Various health insurance reform proposals are also emerging at the state level. Because of the
34