Humana 2009 Annual Report Download - page 108
Download and view the complete annual report
Please find page 108 of the 2009 Humana annual report below. You can navigate through the pages in the report by either clicking on the pages listed below, or by using the keyword search tool below to find specific information within the annual report.-
 1
1 -
2
-
3
-
4
-
5
-
6
-
7
-
8
-
9
-
10
-
11
-
12
-
13
-
14
-
15
-
16
-
17
-
18
-
19
-
20
-
21
-
22
-
23
-
24
-
25
-
26
-
27
-
28
-
29
-
30
-
31
-
32
-
33
-
34
-
35
-
36
-
37
-
38
-
39
-
40
-
41
-
42
-
43
-
44
-
45
-
46
-
47
-
48
-
49
-
50
-
51
-
52
-
53
-
54
-
55
-
56
-
57
-
58
-
59
-
60
-
61
-
62
-
63
-
64
-
65
-
66
-
67
-
68
-
69
-
70
-
71
-
72
-
73
-
74
-
75
-
76
-
77
-
78
-
79
-
80
-
81
-
82
-
83
-
84
-
85
-
86
-
87
-
88
-
89
-
90
-
91
-
92
-
93
-
94
-
95
-
96
-
97
-
 98
98 -
 99
99 -
 100
100 -
 101
101 -
 102
102 -
 103
103 -
 104
104 -
 105
105 -
 106
106 -
 107
107 -
 108
108 -
 109
109 -
 110
110 -
 111
111 -
 112
112 -
 113
113 -
 114
114 -
 115
115 -
 116
116 -
 117
117 -
 118
118 -
119
-
120
-
121
-
122
-
123
-
124
-
125
-
126
-
127
-
128
-
129
-
130
-
131
-
132
-
133
-
134
-
135
-
136
-
137
-
138
-
139
-
140
 |
 |

Humana Inc.
NOTES TO CONSOLIDATED FINANCIAL STATEMENTS—(Continued)
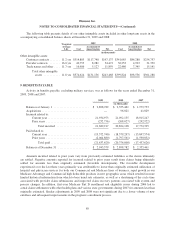
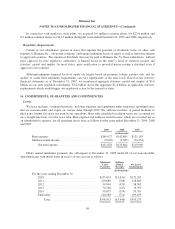
In connection with employee stock plans, we acquired 0.6 million common shares for $22.8 million and
0.2 million common shares for $13.3 million during the years ended December 31, 2009 and 2008, respectively.
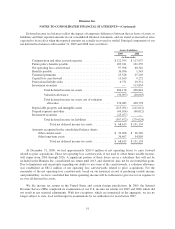
Regulatory Requirements
Certain of our subsidiaries operate in states that regulate the payment of dividends, loans, or other cash
transfers to Humana Inc., our parent company, and require minimum levels of equity as well as limit investments
to approved securities. The amount of dividends that may be paid to Humana Inc. by these subsidiaries, without
prior approval by state regulatory authorities, is limited based on the entity’s level of statutory income and
statutory capital and surplus. In most states, prior notification is provided before paying a dividend even if
approval is not required.
Although minimum required levels of equity are largely based on premium volume, product mix, and the
quality of assets held, minimum requirements can vary significantly at the state level. Based on the statutory
financial statements as of December 31, 2009, we maintained aggregate statutory capital and surplus of $3.6
billion in our state regulated subsidiaries, $1.2 billion above the aggregate $2.4 billion in applicable statutory
requirements which would trigger any regulatory action by the respective states.
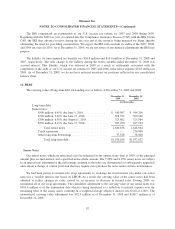
16. COMMITMENTS, GUARANTEES AND CONTINGENCIES
Leases
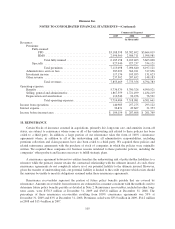
We lease facilities, computer hardware, and other furniture and equipment under long-term operating leases
that are noncancelable and expire on various dates through 2019. We sublease facilities or partial facilities to
third party tenants for space not used in our operations. Rent with scheduled escalation terms are accounted for
on a straight-line basis over the lease term. Rent expense and sublease rental income, which are recorded net as
an administrative expense, for all operating leases were as follows for the years ended December 31, 2009, 2008
and 2007:
2009 2008 2007
(in thousands)
Rent expense ................................ $160,927 $142,885 $121,163
Sublease rental income ......................... (9,049) (9,283) (10,254)
Net rent expense .......................... $151,878 $133,602 $110,909
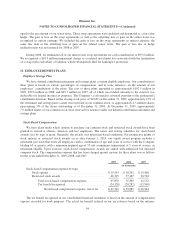
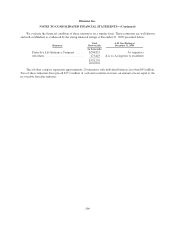
Future annual minimum payments due subsequent to December 31, 2009 under all of our noncancelable
operating leases with initial terms in excess of one year are as follows:
Minimum
Lease
Payments
Sublease
Rental
Receipts
Net Lease
Commitments
(in thousands)
For the years ending December 31:
2010 .................................. $133,634 $(1,431) $132,203
2011 .................................. 119,680 (788) 118,892
2012 .................................. 99,004 (439) 98,565
2013 .................................. 76,540 (147) 76,393
2014 .................................. 59,875 (114) 59,761
Thereafter .............................. 110,180 (721) 109,459
Total .............................. $598,913 $(3,640) $595,273
98