Humana 2009 Annual Report Download - page 131
Download and view the complete annual report
Please find page 131 of the 2009 Humana annual report below. You can navigate through the pages in the report by either clicking on the pages listed below, or by using the keyword search tool below to find specific information within the annual report.-
 1
1 -
2
-
3
-
4
-
5
-
6
-
7
-
8
-
9
-
10
-
11
-
12
-
13
-
14
-
15
-
16
-
17
-
18
-
19
-
20
-
21
-
22
-
23
-
24
-
25
-
26
-
27
-
28
-
29
-
30
-
31
-
32
-
33
-
34
-
35
-
36
-
37
-
38
-
39
-
40
-
41
-
42
-
43
-
44
-
45
-
46
-
47
-
48
-
49
-
50
-
51
-
52
-
53
-
54
-
55
-
56
-
57
-
58
-
59
-
60
-
61
-
62
-
63
-
64
-
65
-
66
-
67
-
68
-
69
-
70
-
71
-
72
-
73
-
74
-
75
-
76
-
77
-
78
-
79
-
80
-
81
-
82
-
83
-
84
-
85
-
86
-
87
-
88
-
89
-
90
-
91
-
92
-
93
-
94
-
95
-
96
-
97
-
98
-
99
-
100
-
101
-
102
-
103
-
104
-
105
-
106
-
107
-
108
-
109
-
110
-
111
-
112
-
113
-
114
-
115
-
116
-
117
-
118
-
119
-
120
-
 121
121 -
 122
122 -
 123
123 -
 124
124 -
 125
125 -
 126
126 -
 127
127 -
 128
128 -
 129
129 -
 130
130 -
 131
131 -
 132
132 -
 133
133 -
 134
134 -
 135
135 -
 136
136 -
 137
137 -
 138
138 -
 139
139 -
 140
140
 |
 |

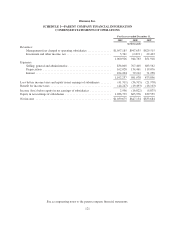
Humana Inc.
SCHEDULE I—PARENT COMPANY FINANCIAL INFORMATION
CONDENSED STATEMENTS OF OPERATIONS
For the year ended December 31,
2009 2008 2007
(in thousands)
Revenues:
Management fees charged to operating subsidiaries ................ $1,057,185 $947,635 $829,515
Investment and other income, net .............................. 3,741 (2,872 ) 22,403
1,060,926 944,763 851,918
Expenses:
Selling, general and administrative ............................. 836,005 767,405 683,562
Depreciation .............................................. 162,028 134,461 119,076
Interest ................................................... 104,204 79,212 71,258
1,102,237 981,078 873,896
Loss before income taxes and equity in net earnings of subsidiaries ....... (41,311) (36,315) (21,978)
Benefit for income taxes ......................................... (44,247) (19,493) (16,103)
Income (loss) before equity in net earnings of subsidiaries .............. 2,936 (16,822) (5,875)
Equity in net earnings of subsidiaries ............................... 1,036,739 663,976 839,559
Net income ................................................... $1,039,675 $647,154 $833,684
See accompanying notes to the parent company financial statements.
121