Humana 2009 Annual Report Download - page 114
Download and view the complete annual report
Please find page 114 of the 2009 Humana annual report below. You can navigate through the pages in the report by either clicking on the pages listed below, or by using the keyword search tool below to find specific information within the annual report.-
 1
1 -
2
-
3
-
4
-
5
-
6
-
7
-
8
-
9
-
10
-
11
-
12
-
13
-
14
-
15
-
16
-
17
-
18
-
19
-
20
-
21
-
22
-
23
-
24
-
25
-
26
-
27
-
28
-
29
-
30
-
31
-
32
-
33
-
34
-
35
-
36
-
37
-
38
-
39
-
40
-
41
-
42
-
43
-
44
-
45
-
46
-
47
-
48
-
49
-
50
-
51
-
52
-
53
-
54
-
55
-
56
-
57
-
58
-
59
-
60
-
61
-
62
-
63
-
64
-
65
-
66
-
67
-
68
-
69
-
70
-
71
-
72
-
73
-
74
-
75
-
76
-
77
-
78
-
79
-
80
-
81
-
82
-
83
-
84
-
85
-
86
-
87
-
88
-
89
-
90
-
91
-
92
-
93
-
94
-
95
-
96
-
97
-
98
-
99
-
100
-
101
-
102
-
103
-
 104
104 -
 105
105 -
 106
106 -
 107
107 -
 108
108 -
 109
109 -
 110
110 -
 111
111 -
 112
112 -
 113
113 -
 114
114 -
 115
115 -
 116
116 -
 117
117 -
 118
118 -
 119
119 -
 120
120 -
 121
121 -
 122
122 -
 123
123 -
 124
124 -
125
-
126
-
127
-
128
-
129
-
130
-
131
-
132
-
133
-
134
-
135
-
136
-
137
-
138
-
139
-
140
 |
 |

Humana Inc.
NOTES TO CONSOLIDATED FINANCIAL STATEMENTS—(Continued)
products marketed to employer groups and individuals. When identifying our segments, we aggregated products
with similar economic characteristics. These characteristics include the nature of customer groups as well as
pricing, benefits, and underwriting requirements. These segment groupings are consistent with information used
by our Chief Executive Officer.
The accounting policies of each segment are the same and are described in Note 2. The results of each
segment are measured by income before income taxes. We allocate all selling, general and administrative
expenses, investment and other revenue, interest expense, and goodwill, but no other assets or liabilities, to our
segments. Members served by our two segments often utilize the same provider networks, in some instances
enabling us to obtain more favorable contract terms with providers. Our segments also share indirect overhead
costs and assets. As a result, the profitability of each segment is interdependent.
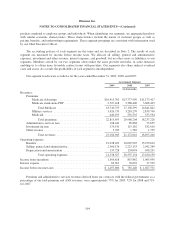
Our segment results were as follows for the years ended December 31, 2009, 2008, and 2007:
Government Segment
2009 2008 2007
(in thousands)
Revenues:
Premiums:
Medicare Advantage .............................. $16,413,301 $13,777,999 $11,173,417
Medicare stand-alone PDP ......................... 2,327,418 3,380,400 3,668,425
Total Medicare .............................. 18,740,719 17,158,399 14,841,842
Military services ................................. 3,426,739 3,218,270 2,839,790
Medicaid ....................................... 646,195 591,535 555,594
Total premiums .............................. 22,813,653 20,968,204 18,237,226
Administrative services fees ............................ 108,442 85,868 73,659
Investment income ................................... 179,141 115,162 182,616
Other revenue ....................................... 3,709 1,782 1,705
Total revenues ............................... 23,104,945 21,171,016 18,495,206
Operating expenses:
Benefits ............................................ 19,038,423 18,007,907 15,279,610
Selling, general and administrative ....................... 2,360,176 2,223,153 2,042,249
Depreciation and amortization .......................... 139,728 124,094 108,291
Total operating expenses ....................... 21,538,327 20,355,154 17,430,150
Income from operations ................................... 1,566,618 815,862 1,065,056
Interest expense .......................................... 69,012 30,622 37,525
Income before income taxes ................................ $ 1,497,606 $ 785,240 $ 1,027,531
Premium and administrative services revenues derived from our contracts with the federal government, as a
percentage of our total premium and ASO revenues, were approximately 73% for 2009, 72% for 2008 and 71%
for 2007.
104