Humana 2009 Annual Report Download - page 51
Download and view the complete annual report
Please find page 51 of the 2009 Humana annual report below. You can navigate through the pages in the report by either clicking on the pages listed below, or by using the keyword search tool below to find specific information within the annual report.-
 1
1 -
2
-
3
-
4
-
5
-
6
-
7
-
8
-
9
-
10
-
11
-
12
-
13
-
14
-
15
-
16
-
17
-
18
-
19
-
20
-
21
-
22
-
23
-
24
-
25
-
26
-
27
-
28
-
29
-
30
-
31
-
32
-
33
-
34
-
35
-
36
-
37
-
38
-
39
-
40
-
 41
41 -
 42
42 -
 43
43 -
 44
44 -
 45
45 -
 46
46 -
 47
47 -
 48
48 -
 49
49 -
 50
50 -
 51
51 -
 52
52 -
 53
53 -
 54
54 -
 55
55 -
 56
56 -
 57
57 -
 58
58 -
 59
59 -
 60
60 -
 61
61 -
62
-
63
-
64
-
65
-
66
-
67
-
68
-
69
-
70
-
71
-
72
-
73
-
74
-
75
-
76
-
77
-
78
-
79
-
80
-
81
-
82
-
83
-
84
-
85
-
86
-
87
-
88
-
89
-
90
-
91
-
92
-
93
-
94
-
95
-
96
-
97
-
98
-
99
-
100
-
101
-
102
-
103
-
104
-
105
-
106
-
107
-
108
-
109
-
110
-
111
-
112
-
113
-
114
-
115
-
116
-
117
-
118
-
119
-
120
-
121
-
122
-
123
-
124
-
125
-
126
-
127
-
128
-
129
-
130
-
131
-
132
-
133
-
134
-
135
-
136
-
137
-
138
-
139
-
140
 |
 |
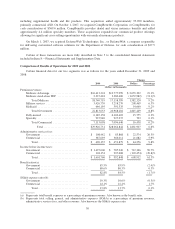
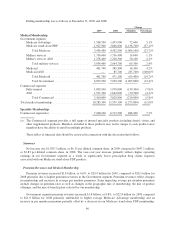
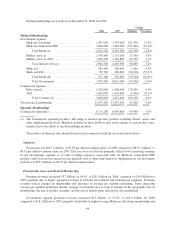
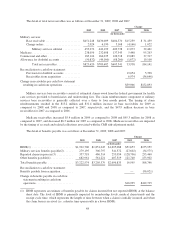
Average membership is calculated by summing the ending membership for each month in a period and dividing
the result by the number of months in a period. Average Medicare Advantage membership increased 11.5% in
2009 compared to 2008, including the impact from the 2008 acquisitions of Cariten, Metcare, OSF, and
SecureHorizons, discussed previously. Sales of our PPO products drove the majority of the 72,600 increase in
Medicare Advantage members since December 31, 2008. Medicare Advantage per member premiums increased
6.8% during 2009 compared to 2008 reflecting the effect of introducing member premiums for most of our
Medicare Advantage products. Medicare stand-alone PDP premium revenues decreased $1.1 billion, or 31.1%,
during 2009 compared to 2008 primarily due to a 1,138,700, or 37.1%, decrease in PDP membership since
December 31, 2008, principally resulting from our competitive positioning as we realigned stand-alone PDP
premium and benefit designs to correspond with our historical prescription drug claims experience.
Commercial segment premium revenues increased $16.5 million, or 0.2%, to $7.1 billion for 2009 primarily
due to the acquisitions of OSF and Cariten in the second and fourth quarters of 2008, respectively, and an
increase in per member premiums, substantially offset by a decline in fully-insured membership. Per member
premiums for fully-insured group accounts increased 5.0% during 2009 compared to 2008. Fully-insured
membership decreased 7.0%, or 139,300 members, to 1,839,500 at December 31, 2009 compared to 1,978,800 at
December 31, 2008 primarily due to the impact of the economic recession which has led to increased in-group
member attrition as employers reduce their workforce levels.
Administrative Services Fees
Our administrative services fees were $496.1 million for 2009, an increase of $44.2 million, or 9.8%, from
$451.9 million for 2008, primarily due to an increase in per member fees, partially offset by a decline in
Commercial ASO membership, primarily isolated to the loss of two larger ASO accounts.
Investment Income
Investment income totaled $296.3 million for 2009, an increase of $76.1 million from $220.2 million for
2008 primarily reflecting net realized losses in 2008 of $79.4 million compared to net realized gains of $19.5
million in 2009. Net realized losses in 2008 primarily resulted from other-than-temporary impairments in our
investment and securities lending portfolios of $103.1 million. Excluding the change associated with net realized
gains/losses, investment income decreased primarily due to lower interest rates, partially offset by higher average
invested balances as a result of the reinvestment of operating cash flow.
Other Revenue
Other revenue totaled $241.2 million for 2009, an increase of $31.8 million from $209.4 million for 2008.
The increase primarily was attributable to increased revenue from growth related to RightSourceRxSM, our mail-
order pharmacy.
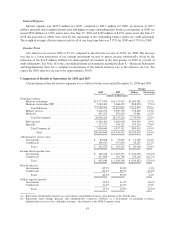
Benefit Expenses
Consolidated benefit expense was $24.8 billion for 2009, an increase of $1.1 billion, or 4.5%, from $23.7
billion for 2008. The increase primarily was driven by an increase in Government segment benefit expense, as
described below.
The consolidated benefit ratio for 2009 was 82.8%, a 170 basis point decrease from 84.5% for 2008. The
decrease primarily was attributable to a decrease in the Government segment benefit ratio as described below.
The Government segment’s benefit expenses increased $1.0 billion, or 5.7%, during 2009 compared to 2008
primarily due to an increase in the average number of Medicare Advantage members and the impact from the
acquisitions of Cariten, Metcare, OSF, and SecureHorizons. The Government segment’s benefit ratio for 2009
41