Humana 2009 Annual Report Download - page 57
Download and view the complete annual report
Please find page 57 of the 2009 Humana annual report below. You can navigate through the pages in the report by either clicking on the pages listed below, or by using the keyword search tool below to find specific information within the annual report.-
 1
1 -
2
-
3
-
4
-
5
-
6
-
7
-
8
-
9
-
10
-
11
-
12
-
13
-
14
-
15
-
16
-
17
-
18
-
19
-
20
-
21
-
22
-
23
-
24
-
25
-
26
-
27
-
28
-
29
-
30
-
31
-
32
-
33
-
34
-
35
-
36
-
37
-
38
-
39
-
40
-
41
-
42
-
43
-
44
-
45
-
46
-
 47
47 -
 48
48 -
 49
49 -
 50
50 -
 51
51 -
 52
52 -
 53
53 -
 54
54 -
 55
55 -
 56
56 -
 57
57 -
 58
58 -
 59
59 -
 60
60 -
 61
61 -
 62
62 -
 63
63 -
 64
64 -
 65
65 -
 66
66 -
 67
67 -
68
-
69
-
70
-
71
-
72
-
73
-
74
-
75
-
76
-
77
-
78
-
79
-
80
-
81
-
82
-
83
-
84
-
85
-
86
-
87
-
88
-
89
-
90
-
91
-
92
-
93
-
94
-
95
-
96
-
97
-
98
-
99
-
100
-
101
-
102
-
103
-
104
-
105
-
106
-
107
-
108
-
109
-
110
-
111
-
112
-
113
-
114
-
115
-
116
-
117
-
118
-
119
-
120
-
121
-
122
-
123
-
124
-
125
-
126
-
127
-
128
-
129
-
130
-
131
-
132
-
133
-
134
-
135
-
136
-
137
-
138
-
139
-
140
 |
 |

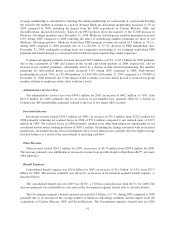
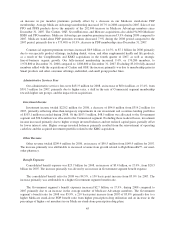
Income Taxes
Our effective tax rate for 2008 of 34.8% compared to the effective tax rate of 35.3% for 2007. The decrease
primarily was due to a lower combined state income tax rate and a greater proportion of tax-exempt investment
income to total pretax income in 2008. See Note 10 to the consolidated financial statements included in Item 8.—
Financial Statements and Supplementary Data for a complete reconciliation of the federal statutory rate to the
effective tax rate.
Liquidity
Our primary sources of cash include receipts of premiums, ASO fees, and investment income, as well as
proceeds from the sale or maturity of our investment securities and from borrowings. Our primary uses of cash
include disbursements for claims payments, SG&A expenses, interest on borrowings, taxes, purchases of
investment securities, acquisitions, capital expenditures, and repayments on borrowings. Because premiums
generally are collected in advance of claim payments by a period of up to several months, our business normally
should produce positive cash flows during periods of increasing premiums and enrollment. Conversely, cash
flows would be negatively impacted during periods of decreasing premiums and enrollment. The use of operating
cash flows may be limited by regulatory requirements which require, among other items, that our regulated
subsidiaries maintain minimum levels of capital.
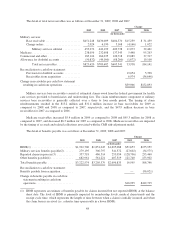
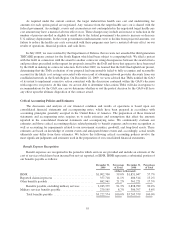
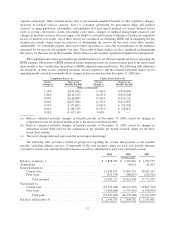
Cash and cash equivalents decreased to $1,613.6 million at December 31, 2009 from $1,970.4 million at
December 31, 2008. The change in cash and cash equivalents for the years ended December 31, 2009, 2008 and
2007 is summarized as follows:
2009 2008 2007
(in thousands)
Net cash provided by operating activities ............. $1,421,582 $ 982,310 $ 1,224,262
Net cash used in investing activities ................. (1,859,261) (498,324) (1,845,391)
Net cash provided by (used in) financing activities ...... 80,844 (554,016) 921,278
(Decrease) increase in cash and cash equivalents ....... $ (356,835) $ (70,030) $ 300,149
Cash Flow from Operating Activities
The change in operating cash flows over the three year period primarily results from the corresponding
change in earnings. Our 2008 operating cash flows and earnings were impacted by significantly higher
prescription drug claim payments for our Medicare stand-alone PDPs as discussed previously.
Comparisons of our operating cash flows also are impacted by other changes in our working capital. The
most significant drivers of changes in our working capital are typically the timing of receipts for premiums and
ASO fees and payments of benefit expenses. We illustrate these changes with the following summaries of
receivables and benefits payable.
47