Humana 2009 Annual Report Download - page 59
Download and view the complete annual report
Please find page 59 of the 2009 Humana annual report below. You can navigate through the pages in the report by either clicking on the pages listed below, or by using the keyword search tool below to find specific information within the annual report.-
 1
1 -
2
-
3
-
4
-
5
-
6
-
7
-
8
-
9
-
10
-
11
-
12
-
13
-
14
-
15
-
16
-
17
-
18
-
19
-
20
-
21
-
22
-
23
-
24
-
25
-
26
-
27
-
28
-
29
-
30
-
31
-
32
-
33
-
34
-
35
-
36
-
37
-
38
-
39
-
40
-
41
-
42
-
43
-
44
-
45
-
46
-
47
-
48
-
 49
49 -
 50
50 -
 51
51 -
 52
52 -
 53
53 -
 54
54 -
 55
55 -
 56
56 -
 57
57 -
 58
58 -
 59
59 -
 60
60 -
 61
61 -
 62
62 -
 63
63 -
 64
64 -
 65
65 -
 66
66 -
 67
67 -
 68
68 -
 69
69 -
70
-
71
-
72
-
73
-
74
-
75
-
76
-
77
-
78
-
79
-
80
-
81
-
82
-
83
-
84
-
85
-
86
-
87
-
88
-
89
-
90
-
91
-
92
-
93
-
94
-
95
-
96
-
97
-
98
-
99
-
100
-
101
-
102
-
103
-
104
-
105
-
106
-
107
-
108
-
109
-
110
-
111
-
112
-
113
-
114
-
115
-
116
-
117
-
118
-
119
-
120
-
121
-
122
-
123
-
124
-
125
-
126
-
127
-
128
-
129
-
130
-
131
-
132
-
133
-
134
-
135
-
136
-
137
-
138
-
139
-
140
 |
 |
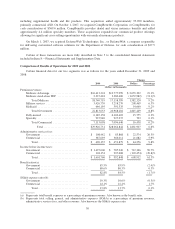
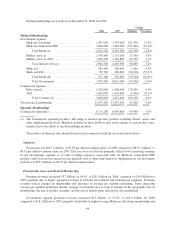
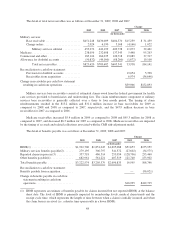
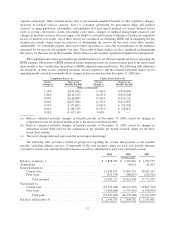
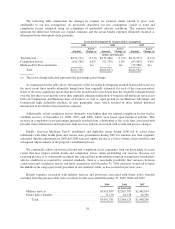
(2) Military services benefits payable primarily results from the timing of the cost of providing health care
services to beneficiaries and the payment to the provider. A corresponding receivable for reimbursement by
the federal government is included in the base receivable in the previous receivables table.
(3) Reported claims in process represents the estimated valuation of processed claims that are in the post claim
adjudication process, which consists of administrative functions such as audit and check batching and
handling, as well as amounts owed to our pharmacy benefit administrator which fluctuate due to bi-weekly
payments and the month-end cutoff.
(4) Other benefits payable include amounts owed to providers under capitated and risk sharing arrangements.
The increase in benefits payable in 2009 primarily was due to an increase in amounts owed to providers
under capitated and risk sharing arrangements as well as an increase in IBNR, both primarily as a result of
Medicare Advantage membership growth, partially offset by a decrease in the amount of processed but unpaid
claims, including pharmacy claims, which fluctuate due to month-end cutoff. The increase in benefits payable in
2008 and 2007 primarily was due to the increase in IBNR from growth in Medicare Advantage members and, to
a lesser extent, benefit claims inflation, an increase in the amount of processed but unpaid claims, including
pharmacy claims, which fluctuate due to month-end cutoff, and an increase in amounts owed to providers under
capitated and risk sharing arrangements from Medicare Advantage membership growth.
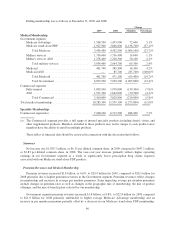
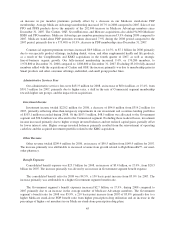
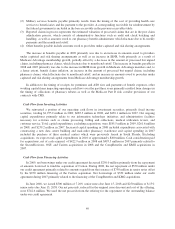
In addition to the timing of receipts for premiums and ASO fees and payments of benefit expenses, other
working capital items impacting operating cash flows over the past three years primarily resulted from changes in
the timing of collections of pharmacy rebates as well as the Medicare Part D risk corridor provisions of our
contracts with CMS.
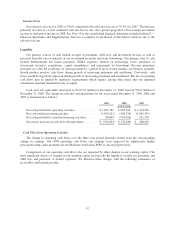
Cash Flow from Investing Activities
We reinvested a portion of our operating cash flows in investment securities, primarily fixed income
securities, totaling $1,975.2 million in 2009, $685.5 million in 2008, and $430.1 million in 2007. Our ongoing
capital expenditures primarily relate to our information technology initiatives and administrative facilities
necessary for activities such as claims processing, billing and collections, medical utilization review, and
customer service. Total capital expenditures, excluding acquisitions, were $185.5 million in 2009, $261.6 million
in 2008, and $239.2 million in 2007. Increased capital spending in 2008 included expenditures associated with
constructing a new data center building and mail-order pharmacy warehouse and capital spending in 2007
included the purchase of three medical centers which were previously leased in South Florida. Excluding
acquisitions, we expect total capital expenditures in 2010 of approximately $200 million. Cash consideration paid
for acquisitions, net of cash acquired, of $422.9 million in 2008 and $493.5 million in 2007 primarily related to
the SecureHorizons, OSF, and Cariten acquisitions in 2008 and the CompBenefits and KMG acquisitions in
2007.
Cash Flow from Financing Activities
In 2009, net borrowings under our credit agreement decreased $250.0 million primarily from the repayment
of amounts borrowed to fund the acquisition of Cariten. During 2008, the net repayment of $550 million under
our credit agreement primarily related to amounts repaid from the issuance of $750 million in senior notes offset
by the $250 million financing of the Cariten acquisition. Net borrowings of $350 million under our credit
agreement during 2007 primarily related to the financing of the CompBenefits and KMG acquisitions.
In June 2008, we issued $500 million of 7.20% senior notes due June 15, 2018 and $250 million of 8.15%
senior notes due June 15, 2038. Our net proceeds, reduced for the original issue discount and cost of the offering,
were $742.6 million. We used the net proceeds from the offering for the repayment of the outstanding balance
under our credit agreement.
49