Humana 2009 Annual Report Download - page 52
Download and view the complete annual report
Please find page 52 of the 2009 Humana annual report below. You can navigate through the pages in the report by either clicking on the pages listed below, or by using the keyword search tool below to find specific information within the annual report.-
 1
1 -
2
-
3
-
4
-
5
-
6
-
7
-
8
-
9
-
10
-
11
-
12
-
13
-
14
-
15
-
16
-
17
-
18
-
19
-
20
-
21
-
22
-
23
-
24
-
25
-
26
-
27
-
28
-
29
-
30
-
31
-
32
-
33
-
34
-
35
-
36
-
37
-
38
-
39
-
40
-
41
-
 42
42 -
 43
43 -
 44
44 -
 45
45 -
 46
46 -
 47
47 -
 48
48 -
 49
49 -
 50
50 -
 51
51 -
 52
52 -
 53
53 -
 54
54 -
 55
55 -
 56
56 -
 57
57 -
 58
58 -
 59
59 -
 60
60 -
 61
61 -
 62
62 -
63
-
64
-
65
-
66
-
67
-
68
-
69
-
70
-
71
-
72
-
73
-
74
-
75
-
76
-
77
-
78
-
79
-
80
-
81
-
82
-
83
-
84
-
85
-
86
-
87
-
88
-
89
-
90
-
91
-
92
-
93
-
94
-
95
-
96
-
97
-
98
-
99
-
100
-
101
-
102
-
103
-
104
-
105
-
106
-
107
-
108
-
109
-
110
-
111
-
112
-
113
-
114
-
115
-
116
-
117
-
118
-
119
-
120
-
121
-
122
-
123
-
124
-
125
-
126
-
127
-
128
-
129
-
130
-
131
-
132
-
133
-
134
-
135
-
136
-
137
-
138
-
139
-
140
 |
 |
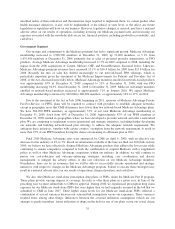
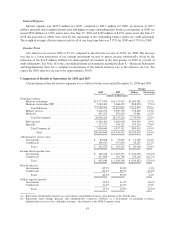
was 83.5%, a 240 basis point decrease from 2008 of 85.9%, primarily driven by a 320 basis point decline in the
Medicare benefit ratio. The decline in the Medicare benefit ratio primarily resulted from a substantial decline in
Medicare stand-alone PDP benefit expenses as a result of our competitive positioning as we realigned stand-
alone PDP premium and benefit designs to correspond with our historical prescription drug claims experience.
The Commercial segment’s benefit expenses increased $36.3 million, or 0.6%, during 2009 compared to 2008
primarily due to the OSF and Cariten acquisitions in the second and fourth quarters of 2008, respectively. The benefit
ratio for the Commercial segment of 80.6% for 2009 increased 30 basis points from the 2008 benefit ratio of 80.3%,
primarily reflecting higher utilization associated with the general economy and the highly competitive environment, as
well as the impact of the H1N1 virus, partially offset by an increase in per member premiums. We experienced higher
utilization of benefits in our fully-insured group accounts as in-group attrition, primarily as a result of reductions of less
experienced workers, has led to a shift in the mix of members to an older workforce having more health care needs, as
well as members utilizing more benefits ahead of actual or perceived layoffs, members seeking to maximize their
benefits once their deductibles are met, and increased COBRA participation.
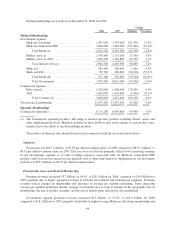
SG&A Expense
Consolidated SG&A expenses increased $282.9 million, or 7.2%, during 2009 compared to 2008. The
increase primarily resulted from an increase in the average number of our employees due to the Medicare growth
and higher average individual product membership. The average number of our employees increased 1,600 to
28,500 for 2009 from 26,900 for 2008, or 5.9%.
The consolidated SG&A expense ratio for 2009 was 13.8%, increasing 10 basis points from 13.7% for 2008
primarily due to an increase in the Commercial segment SG&A expense ratio as discussed below. The
consolidated SG&A expense ratio is expected to decrease to a range of 13.0% to 13.5% for 2010 from efforts to
realign our cost structure.
Our Government and Commercial segments incur both direct and shared indirect overhead SG&A expenses.
We allocate the indirect overhead expenses shared by the two segments primarily as a function of revenues. As a
result, the profitability of each segment is interdependent.
SG&A expenses in the Government segment increased $137.0 million, or 6.2%, during 2009 compared to
2008. The Government segment SG&A expense ratio decreased 30 basis points from 10.6% for 2008 to 10.3%
for 2009. The decrease primarily resulted from efficiency gains associated with servicing higher average
Medicare Advantage membership. For example, during 2009 we transitioned the recently acquired OSF and
Metcare members into our primary Medicare service platform and eliminated the cost of having duplicate
platforms.
Commercial segment SG&A expenses increased $145.9 million, or 8.5%, during 2009 compared to 2008.
The Commercial segment SG&A expense ratio increased 170 basis points from 22.4% for 2008 to 24.1% for
2009. The increase primarily was due to administrative costs associated with increased business for our mail-
order pharmacy and higher average individual product membership. Average individual product membership
increased 17.6% during 2009 compared to 2008. Individual accounts bear a higher SG&A expense ratio due to
higher distribution costs as compared to larger accounts.
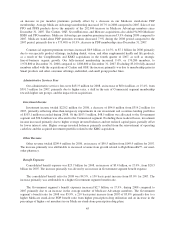
Depreciation and Amortization
Depreciation and amortization for 2009 totaled $250.3 million compared to $220.4 million for 2008, an
increase of $29.9 million, or 13.6%, primarily reflecting depreciation expense associated with capital
expenditures since December 31, 2008.
42