Humana 2009 Annual Report Download - page 45
Download and view the complete annual report
Please find page 45 of the 2009 Humana annual report below. You can navigate through the pages in the report by either clicking on the pages listed below, or by using the keyword search tool below to find specific information within the annual report.-
 1
1 -
2
-
3
-
4
-
5
-
6
-
7
-
8
-
9
-
10
-
11
-
12
-
13
-
14
-
15
-
16
-
17
-
18
-
19
-
20
-
21
-
22
-
23
-
24
-
25
-
26
-
27
-
28
-
29
-
30
-
31
-
32
-
33
-
34
-
 35
35 -
 36
36 -
 37
37 -
 38
38 -
 39
39 -
 40
40 -
 41
41 -
 42
42 -
 43
43 -
 44
44 -
 45
45 -
 46
46 -
 47
47 -
 48
48 -
 49
49 -
 50
50 -
 51
51 -
 52
52 -
 53
53 -
 54
54 -
 55
55 -
56
-
57
-
58
-
59
-
60
-
61
-
62
-
63
-
64
-
65
-
66
-
67
-
68
-
69
-
70
-
71
-
72
-
73
-
74
-
75
-
76
-
77
-
78
-
79
-
80
-
81
-
82
-
83
-
84
-
85
-
86
-
87
-
88
-
89
-
90
-
91
-
92
-
93
-
94
-
95
-
96
-
97
-
98
-
99
-
100
-
101
-
102
-
103
-
104
-
105
-
106
-
107
-
108
-
109
-
110
-
111
-
112
-
113
-
114
-
115
-
116
-
117
-
118
-
119
-
120
-
121
-
122
-
123
-
124
-
125
-
126
-
127
-
128
-
129
-
130
-
131
-
132
-
133
-
134
-
135
-
136
-
137
-
138
-
139
-
140
 |
 |
unsettled nature of these initiatives and the numerous steps required to implement them, we cannot predict what
health insurance initiatives, if any, will be implemented at the federal or state level, or the effect any future
legislation or regulation will have on our business. However, legislative changes, if enacted, may have a material
adverse affect on our results of operations, including lowering our Medicare payment rates and increasing our
expenses associated with the non-deductible excise tax, financial position, including goodwill recoverability, and
cash flows.
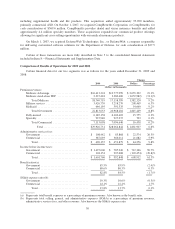
Government Segment
Our strategy and commitment to the Medicare programs has led to significant growth. Medicare Advantage
membership increased to 1,508,500 members at December 31, 2009, up 72,600 members, or 5.1% from
1,435,900 members at December 31, 2008, primarily due to sales of preferred provider organization, or PPO
products. Average Medicare Advantage membership increased 11.5% in 2009 compared to 2008, including the
impact from the 2008 acquisitions of Cariten, Metcare, OSF, and SecureHorizons, discussed below. Likewise,
Medicare Advantage premium revenues have increased 19.1% to $16.4 billion for 2009 from $13.8 billion for
2008. Recently the mix of sales has shifted increasingly to our network-based PPO offerings, which is
particularly important given the enactment of the Medicare Improvements for Patients and Providers Act of
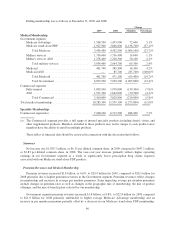
2008, or the Act, discussed more fully below. Medicare Advantage members enrolled in network-based products
was approximately 63% at December 31, 2009 compared to 51% at December 31, 2008, with our PPO
membership increasing 94.6% from December 31, 2008 to December 31, 2009. Medicare Advantage members
enrolled in network-based products increased to approximately 71% in January 2010. We expect Medicare
Advantage membership to increase by 240,000 to 260,000 members, or approximately 16% to 17%, in 2010.
Due to the enactment of the Act in July 2008, beginning in 2011, sponsors of Medicare Advantage Private
Fee-For-Service, or PFFS, plans will be required to contract with providers to establish adequate networks,
except in geographic areas that CMS determines have fewer than two network-based Medicare Advantage plans.
We have 564,200 PFFS members, or approximately 37% of our total Medicare Advantage membership at
December 31, 2009, down from 49% at December 31, 2008. Approximately 87% of our PFFS members at
December 31, 2009 resided in geographies where we have developed a provider network and offer a networked
plan. We are continuing to implement various operational and strategic initiatives, including further developing
our networks and building network-based plan offerings to address the adequate network requirement. We
anticipate these initiatives, together with certain counties’ exemption from the network requirement, to result in
more than 95% of our PFFS members having the choice of remaining in a Humana plan in 2011.
Final 2010 Medicare Advantage rates were announced by CMS on April 6, 2009, with an effective rate
decrease for the industry of 4% to 5%. Based on information available at the time we filed our 2010 bids in June
2009, we believe we have effectively designed Medicare Advantage products that address the lower rates while
continuing to remain competitive compared to both the combination of original Medicare with a supplement
policy as well as other Medicare Advantage competitors within our industry. In addition, we will continue to
pursue our cost-reduction and outcome-enhancing strategies, including care coordination and disease
management, to mitigate the adverse effects of this rate reduction on our Medicare Advantage members.
Nonetheless, there can be no assurance that we will be able to successfully execute operational and strategic
initiatives with respect to changes in the Medicare Advantage program. Failure to execute these strategies may
result in a material adverse effect on our results of operations, financial position, and cash flows.
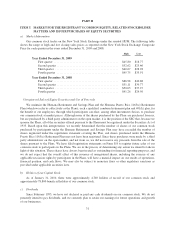
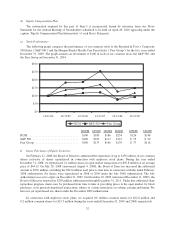
We also offer Medicare stand-alone prescription drug plans, or PDPs, under the Medicare Part D program.
These plans provide varying degrees of coverage. In order to offer these plans in a given year, in June of the
preceding year we must submit bids to CMS for approval. During 2008, we experienced prescription drug claim
expenses for our Medicare stand-alone PDPs that were higher than we had originally assumed in the bid that we
submitted to CMS in June 2007. These higher claim levels for our Medicare stand-alone PDPs reflected a
combination of several variances between our actuarial bid assumptions versus our experience. These variances
resulted from, among other things, differences between the actuarial utilization assumptions (which are our
attempts to predict members’ future utilization of drugs) in the bids for one of our plans versus our actual claims
35